Using the Datasnare Report Server to Investigate Alcohol Consumption Around the World
Alcohol has a complicated place in human history. For as long as we can track, the drink has held an important role in socializing and bonding.
When enjoyed moderately, the ethanol in our favorite alcoholic beverages helps release serotonin, dopamine, and endorphins in the brain, chemicals that make us happy and less anxious.
Think of all those gatherings where alcohol makes an appearance:
- Weddings:
- Given as gifts to the couple
- Beer, wine and spirits to be enjoyed by guests and used for toasts.
- Sporting Events:
- A cold beer while cheering on your favorite baseball or soccer team
- The clubhouse stop after a round of golf
- Religious ceremonies:
- Red wine during Christian communion and the Jewish kiddush ceremony
- Sake offered to deities at Shinto shrines
- Rice wine and beer offered by Taoists to ward off ghosts and spirits
- Countless other religious ceremonies (seriously though, religions love their alcohol)
- Company Gatherings:
- What would the yearly Christmas party be without the eggnog or a few (too many) glasses of wine?
- The Friday “Lunch Beer”
We’ll you’re certainly not alone. The World Health Organization tracks this data, and for reasons that may be unclear at first. Outside of pure curiosity tracking alcohol consumption can be useful for projecting social, cultural, economic, and health trends.
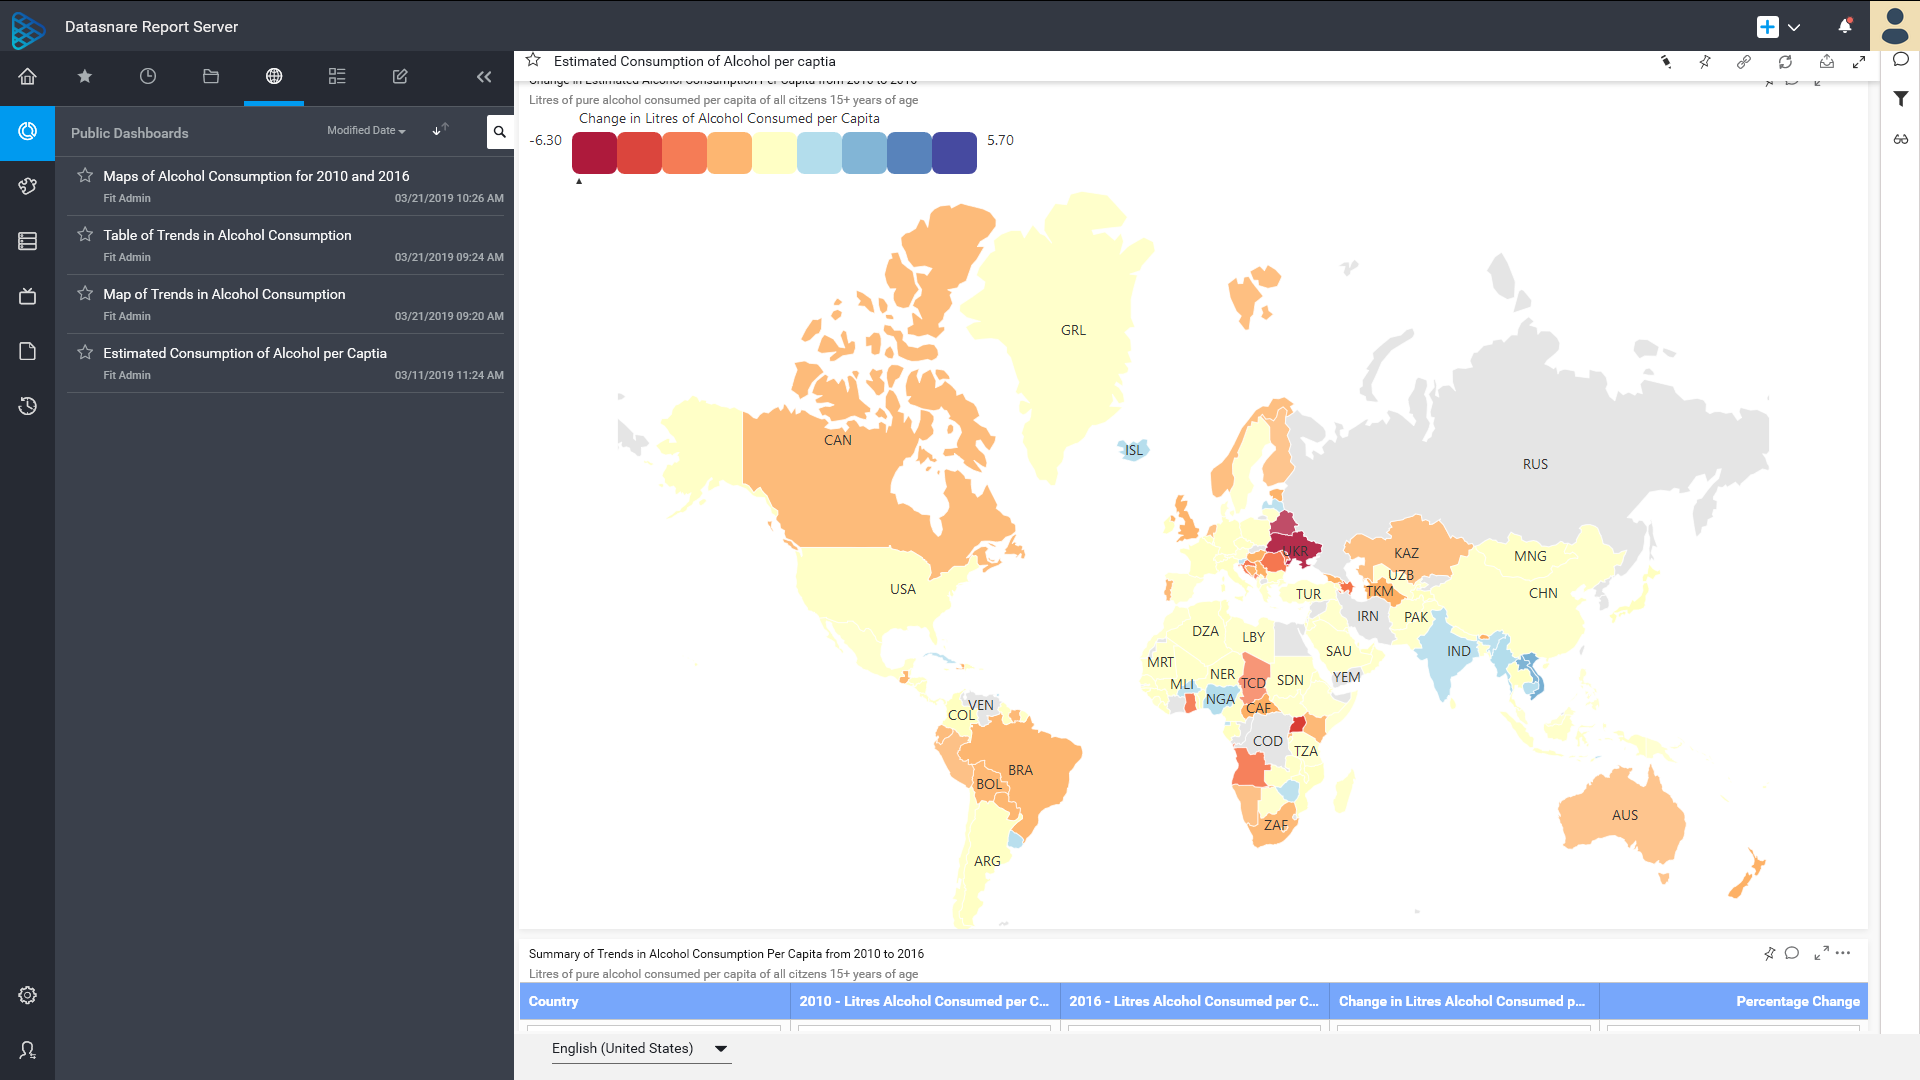
That’s why we’ve decided to use our Datasnare Report Server to visualize the data provided by WHO. To start off, we’ve used the Choropleth Map Widget (a color shaded map) to rank alcohol consumption side by side for the two years that WHO has published their data: 2010 and 2016.
Let’s check out our maps and see what conclusions we can draw.
By looking at the maps there are a few things that may immediately stick out.
- Russia is missing from the data set. Alongside countries like Egypt and Iran.
- Understanding the areas where your data is incomplete is an important consideration to keep in mind when trying to determine what the data could be telling us.
- Europe has a concentration of high alcohol consumption countries.
- Many of the largest producers of alcohol in the world call the European countries home. Germany is famous for it’s beer, France for it’s wine, and so on. Add in long standing traditions and an economically stable population, and it’s no surprise that the citizens of Europe lead the way.
- The less developed portions of central and northern Africa have lower average alcohol consumption.
- This correlates to what we would expect when we said that alcohol consumption can be an indicator of economic conditions within a country. Of course, other factors should be considered, but this is one way to view the data.
Embedding Public Reports in Web Pages
One of the great benefits of using Datasnare’s Report Server to visualize your data are the different options you have to share your data and visualizations. The maps and tables seen in this post are Dashboards created on the Datasnare Report Server.
Since we’re using non-sensitive, publicly-available data, we can choose to publish these reports publicly, allowing anyone with whom you share the report link to view and interact with the data.
For this post we’ve taken it one step further, and used our dashboard embedding option to share the visualizations directly on this page.
Creating the Dashboard

First, we created the Dashboard using the Datasnare Dashboard Designer from within the Datasnare Report Server. We linked in the WHO Data Source and created both of our Choropleth maps. We then published the finished Dashboard to the Datasnare Report Server and organized all of our Public reports into a Dashboard Category called “Marketing and Blog Dashboards.”
Making the Dashboard Public

We then select “…” next to the Dashboard we wish to make public to see additional options. To make the Dashboard public we go to Privacy Settings > Public and confirm our selection by hitting the Change button.
The report is now available at the Dashboard’s URL and published to the world!
Embedding the Dashboard

If you wish to embed the Dashboard into a webpage like we have on this one, all you need to do is:
Select the “…” next to the Dashboard you wish to embed and select Get Embed Code. Copy the code to your computers clipboard and simply paste it into the webpage you want it to be embedded into. The dashboard will be loaded in an iframe and will load the most recent version of the report each time it’s requested. It’s as simple as that!