[rev_slider alias=”sample-dashboards” /]
Datasnare – Sample Dashboards
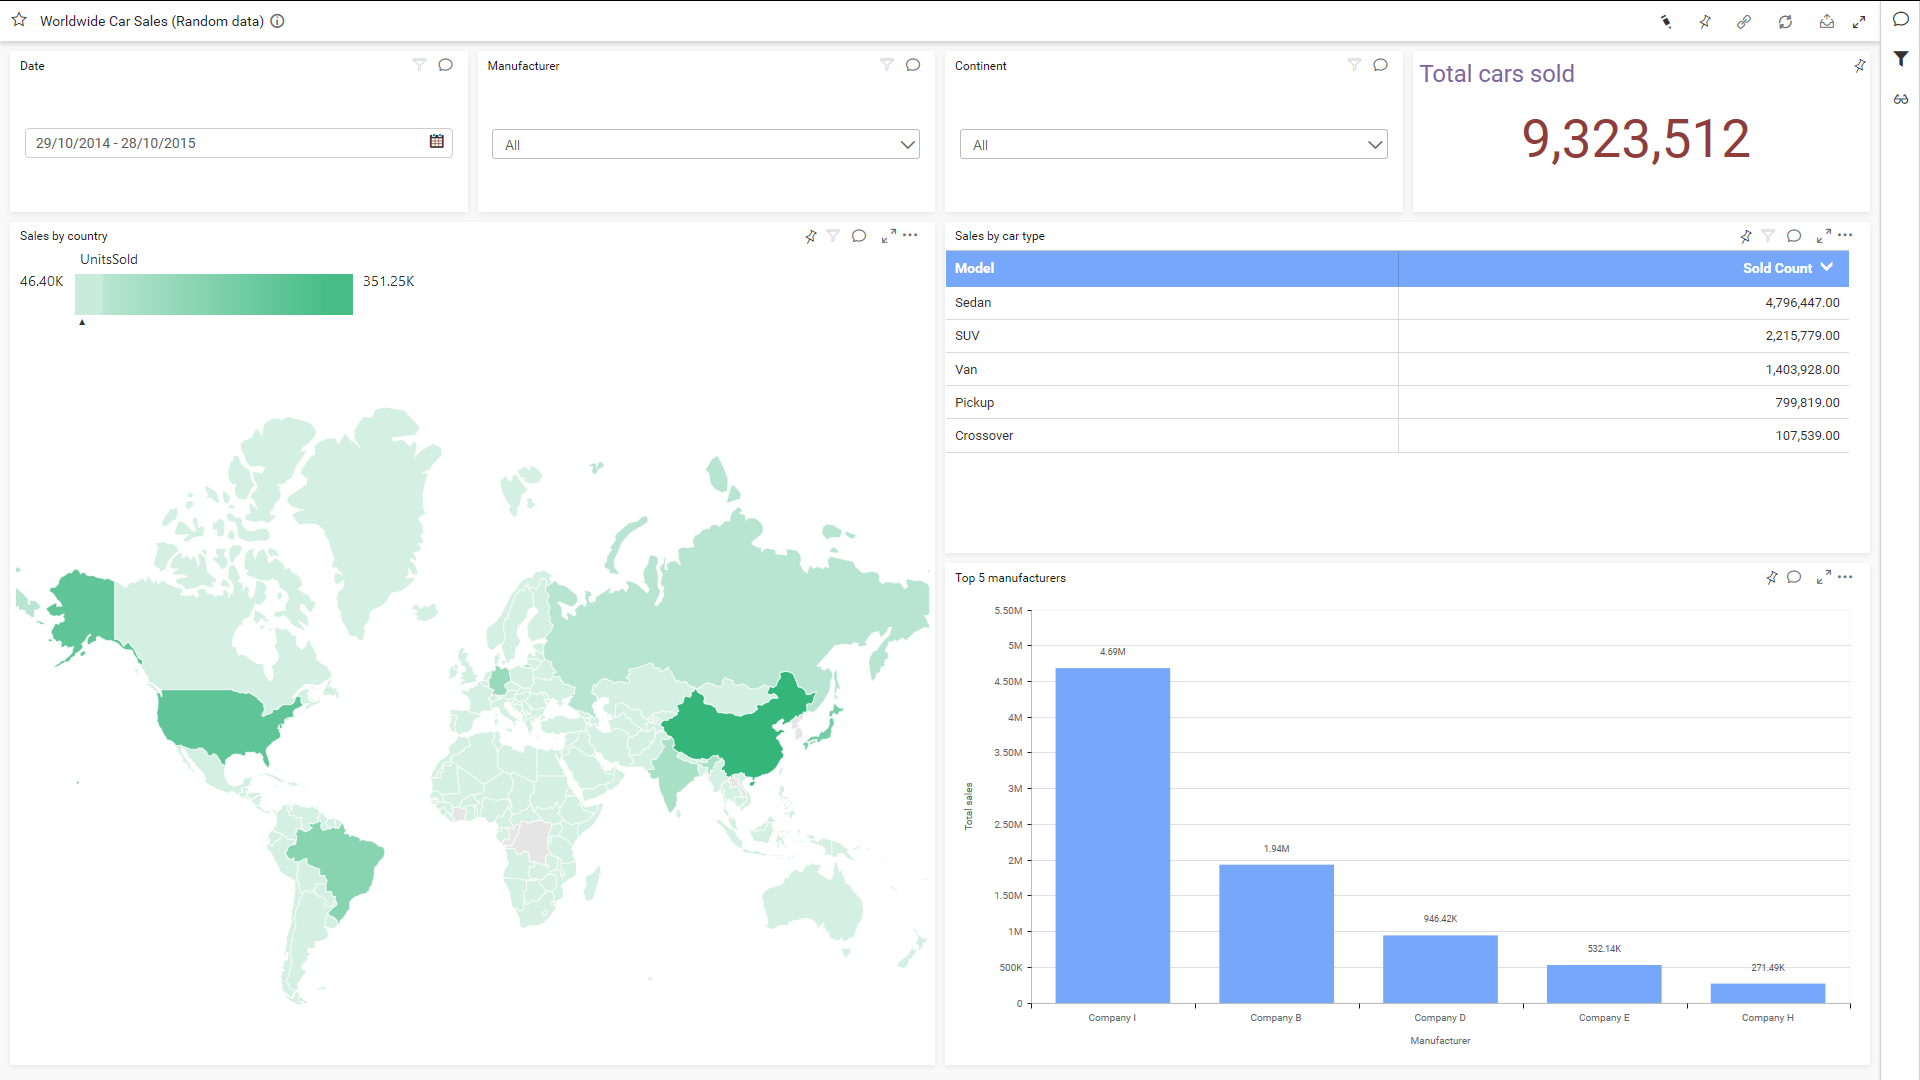
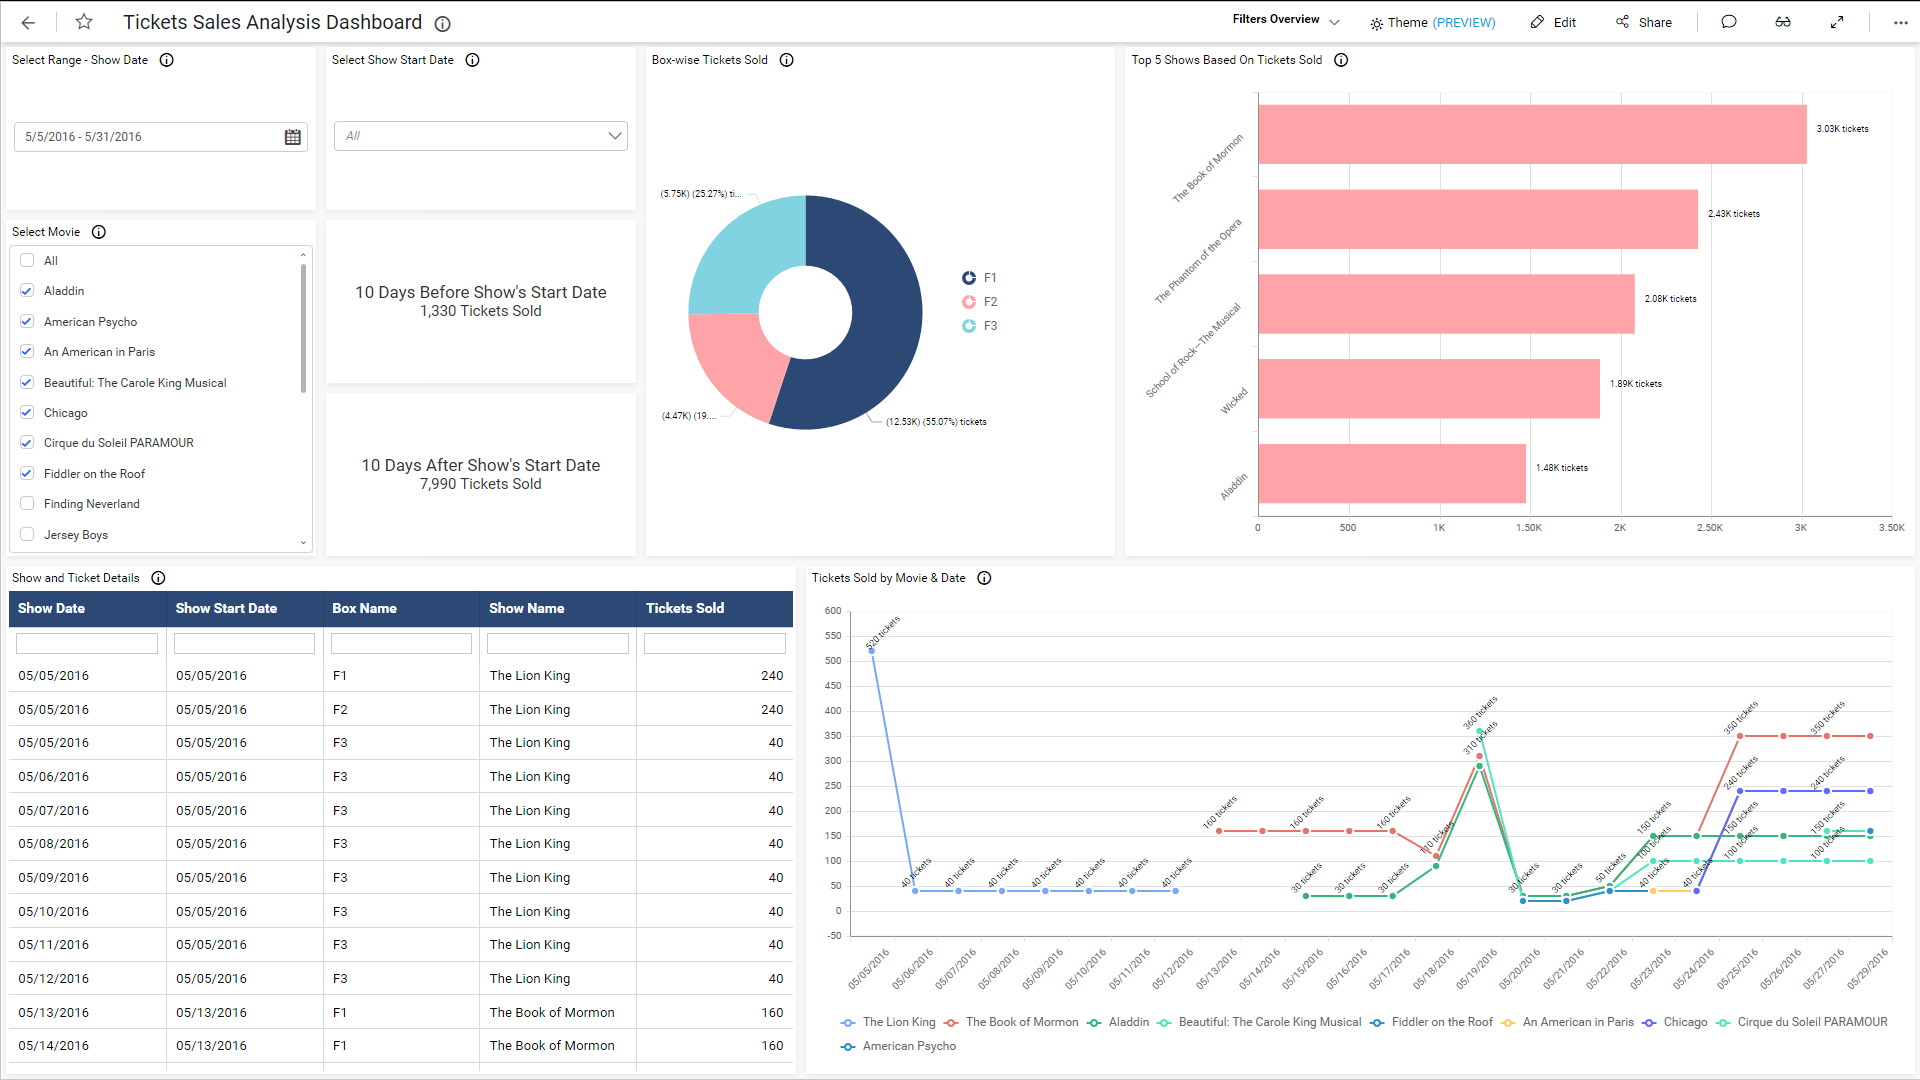
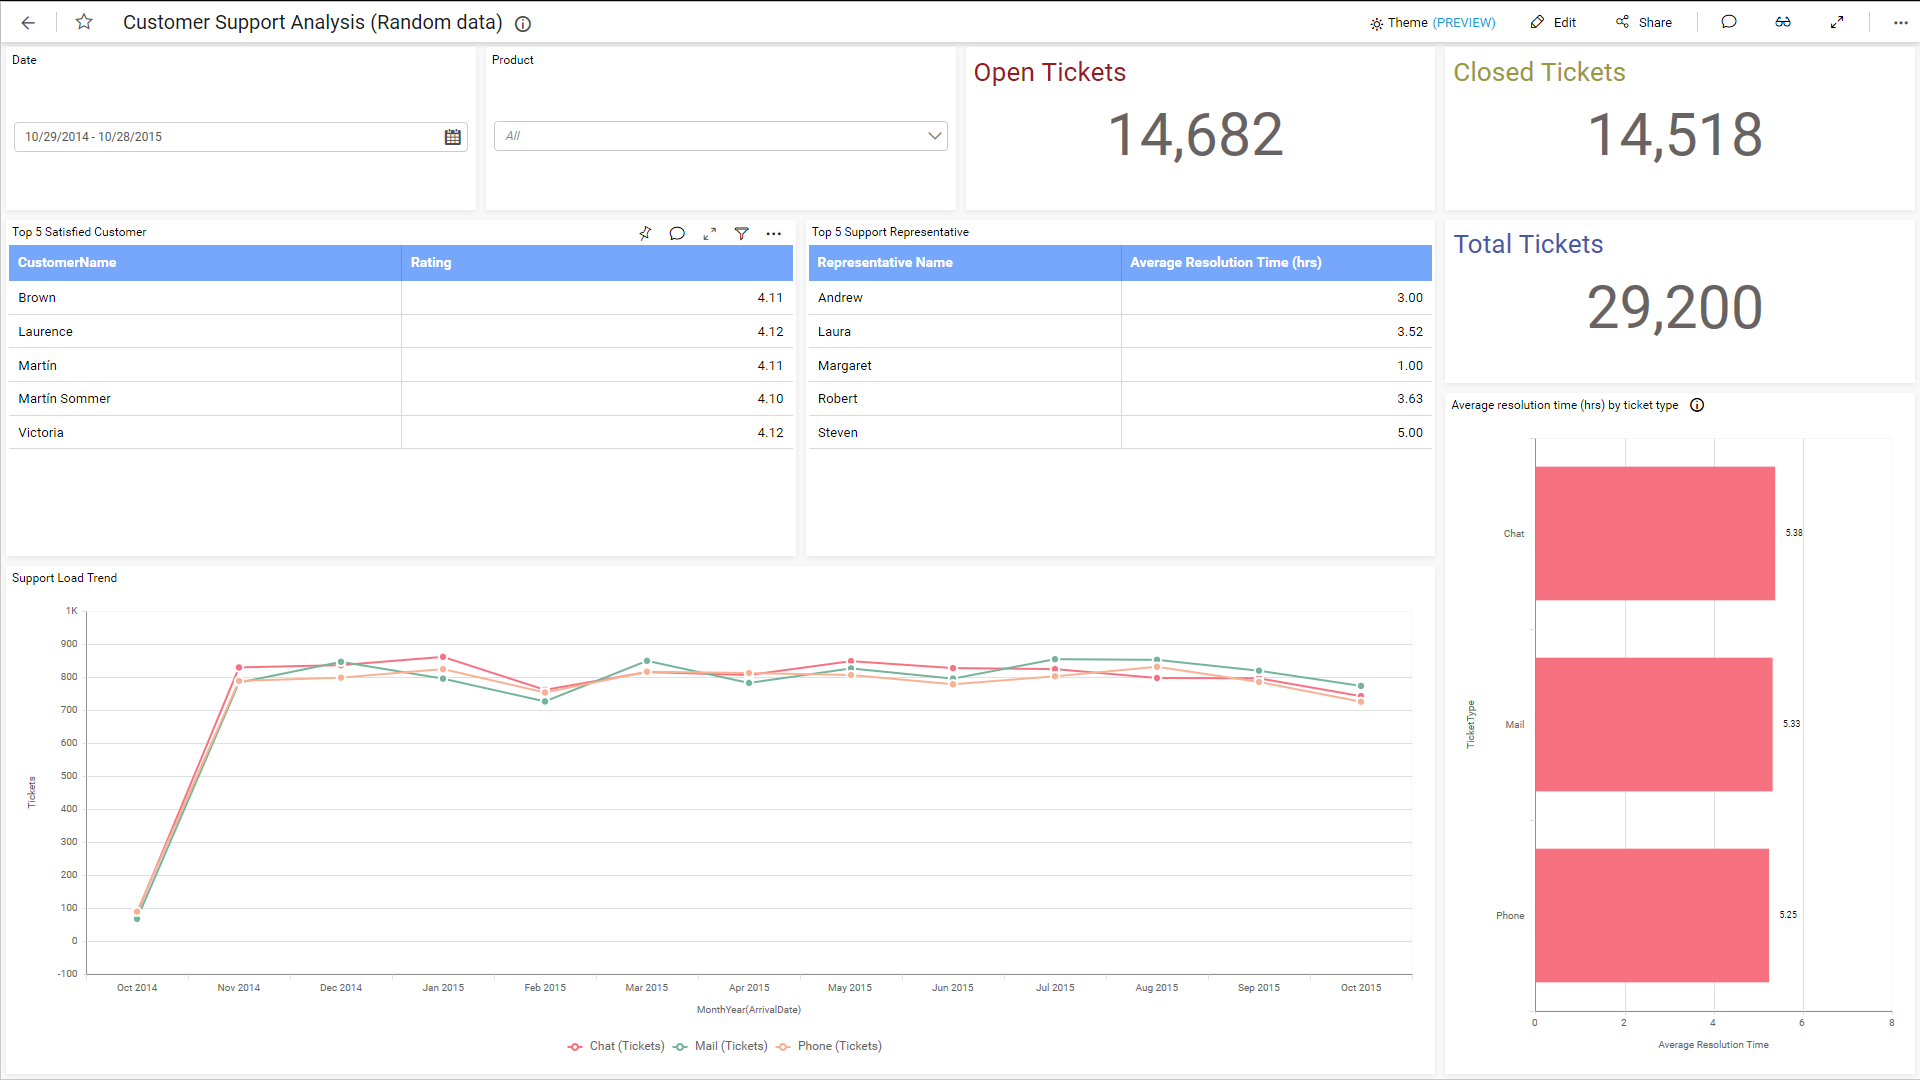
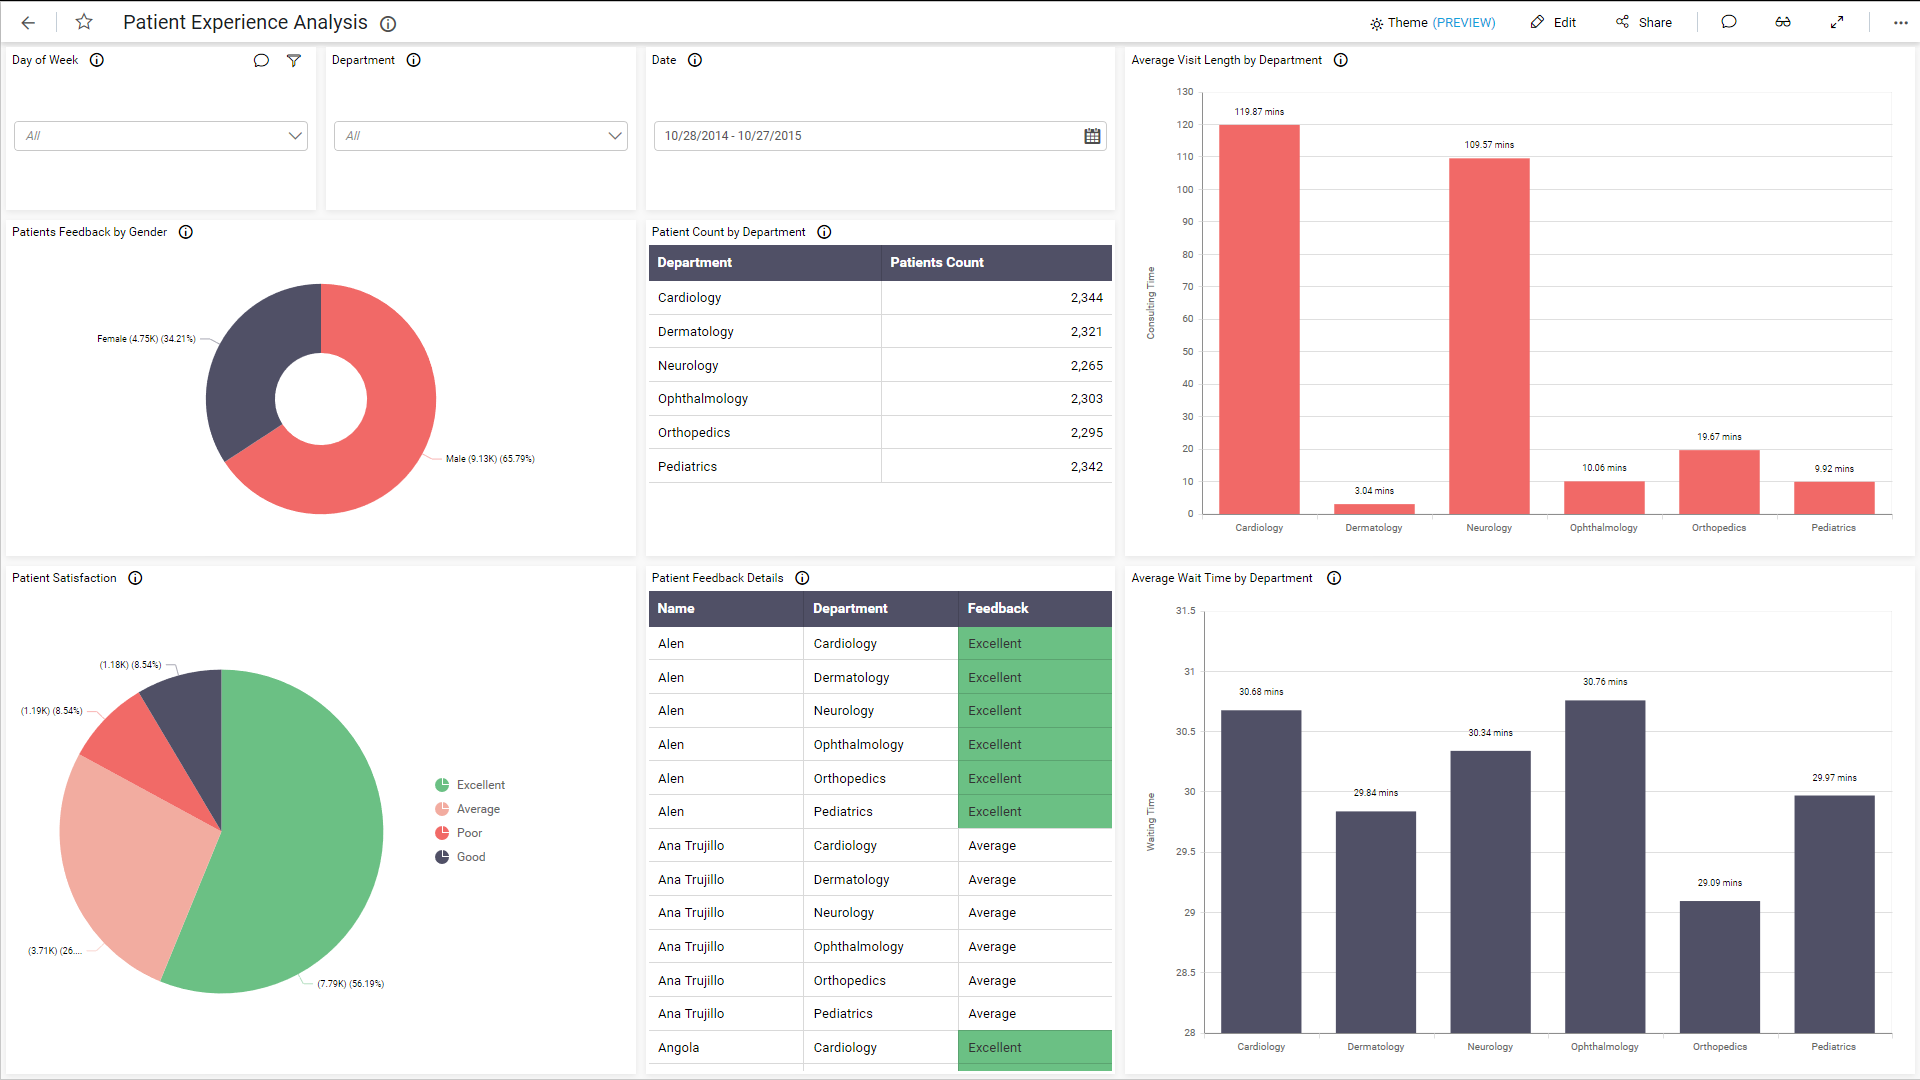
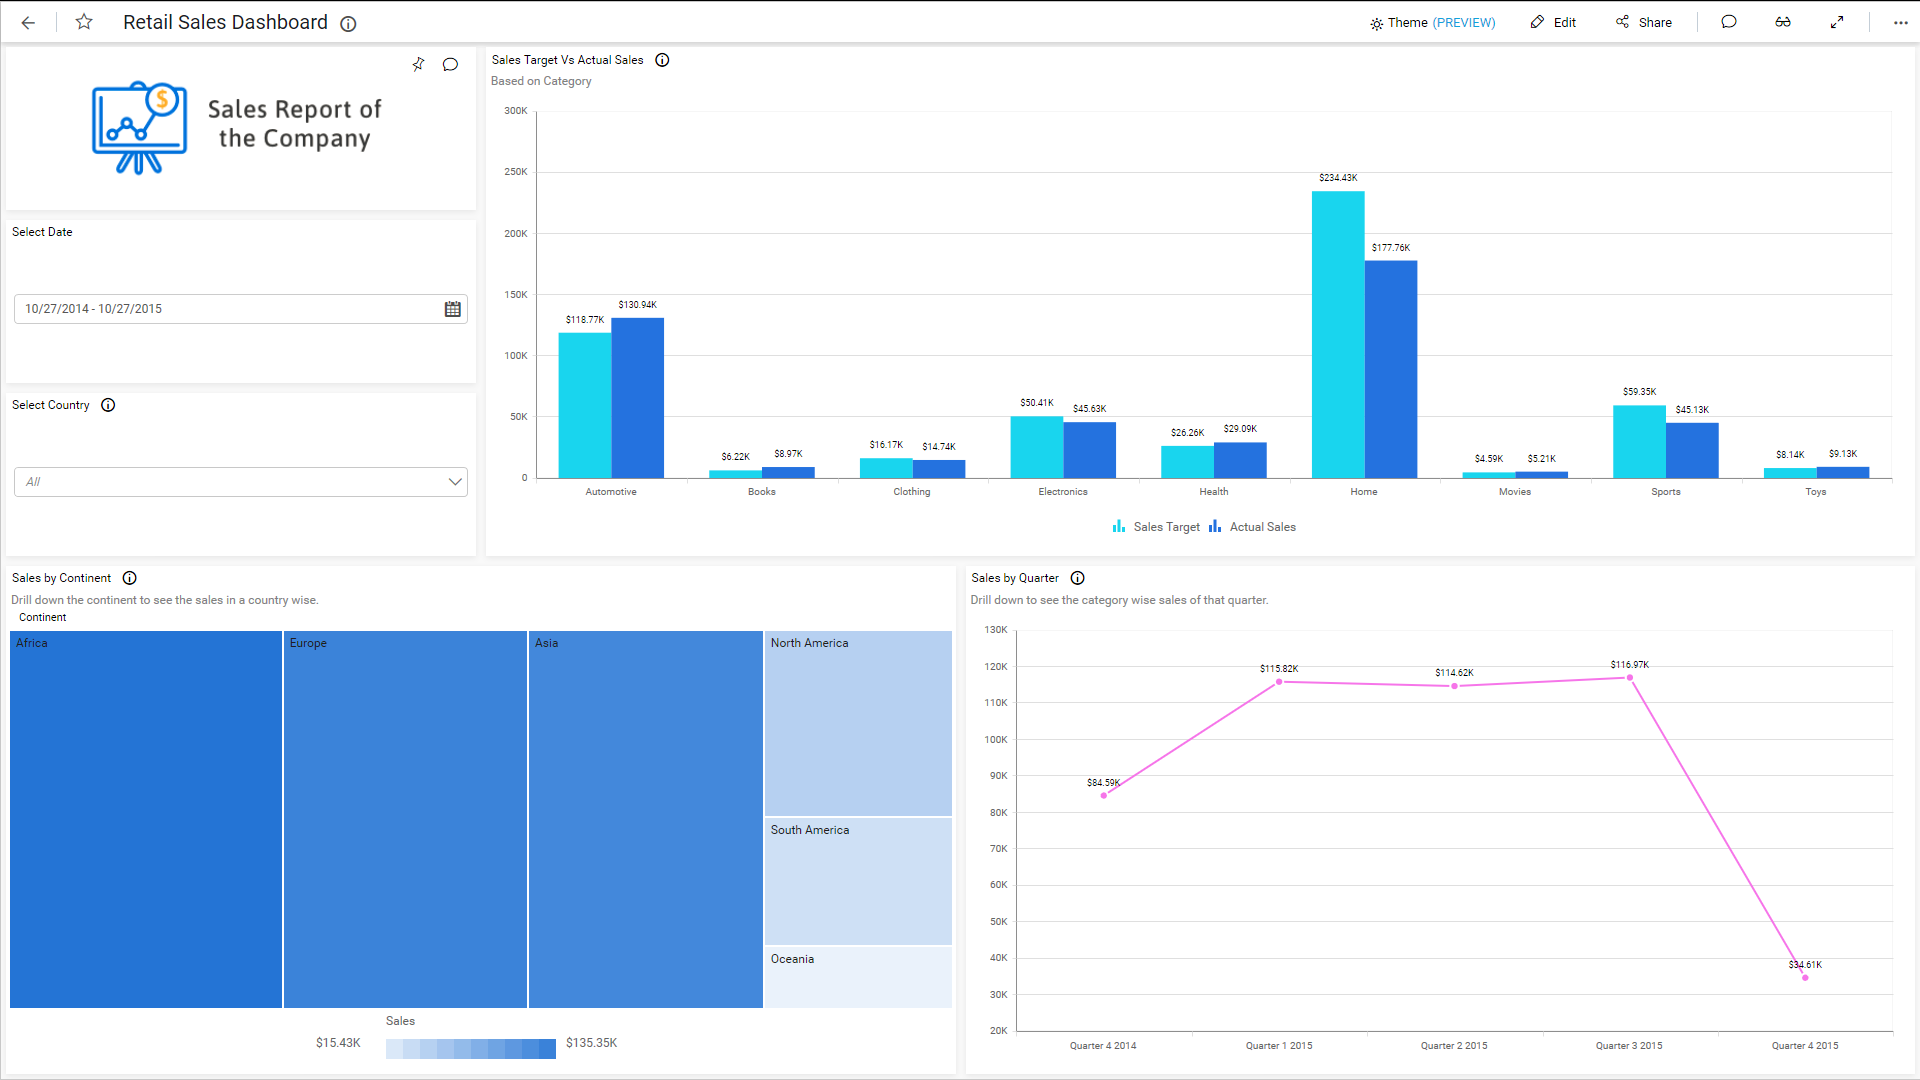
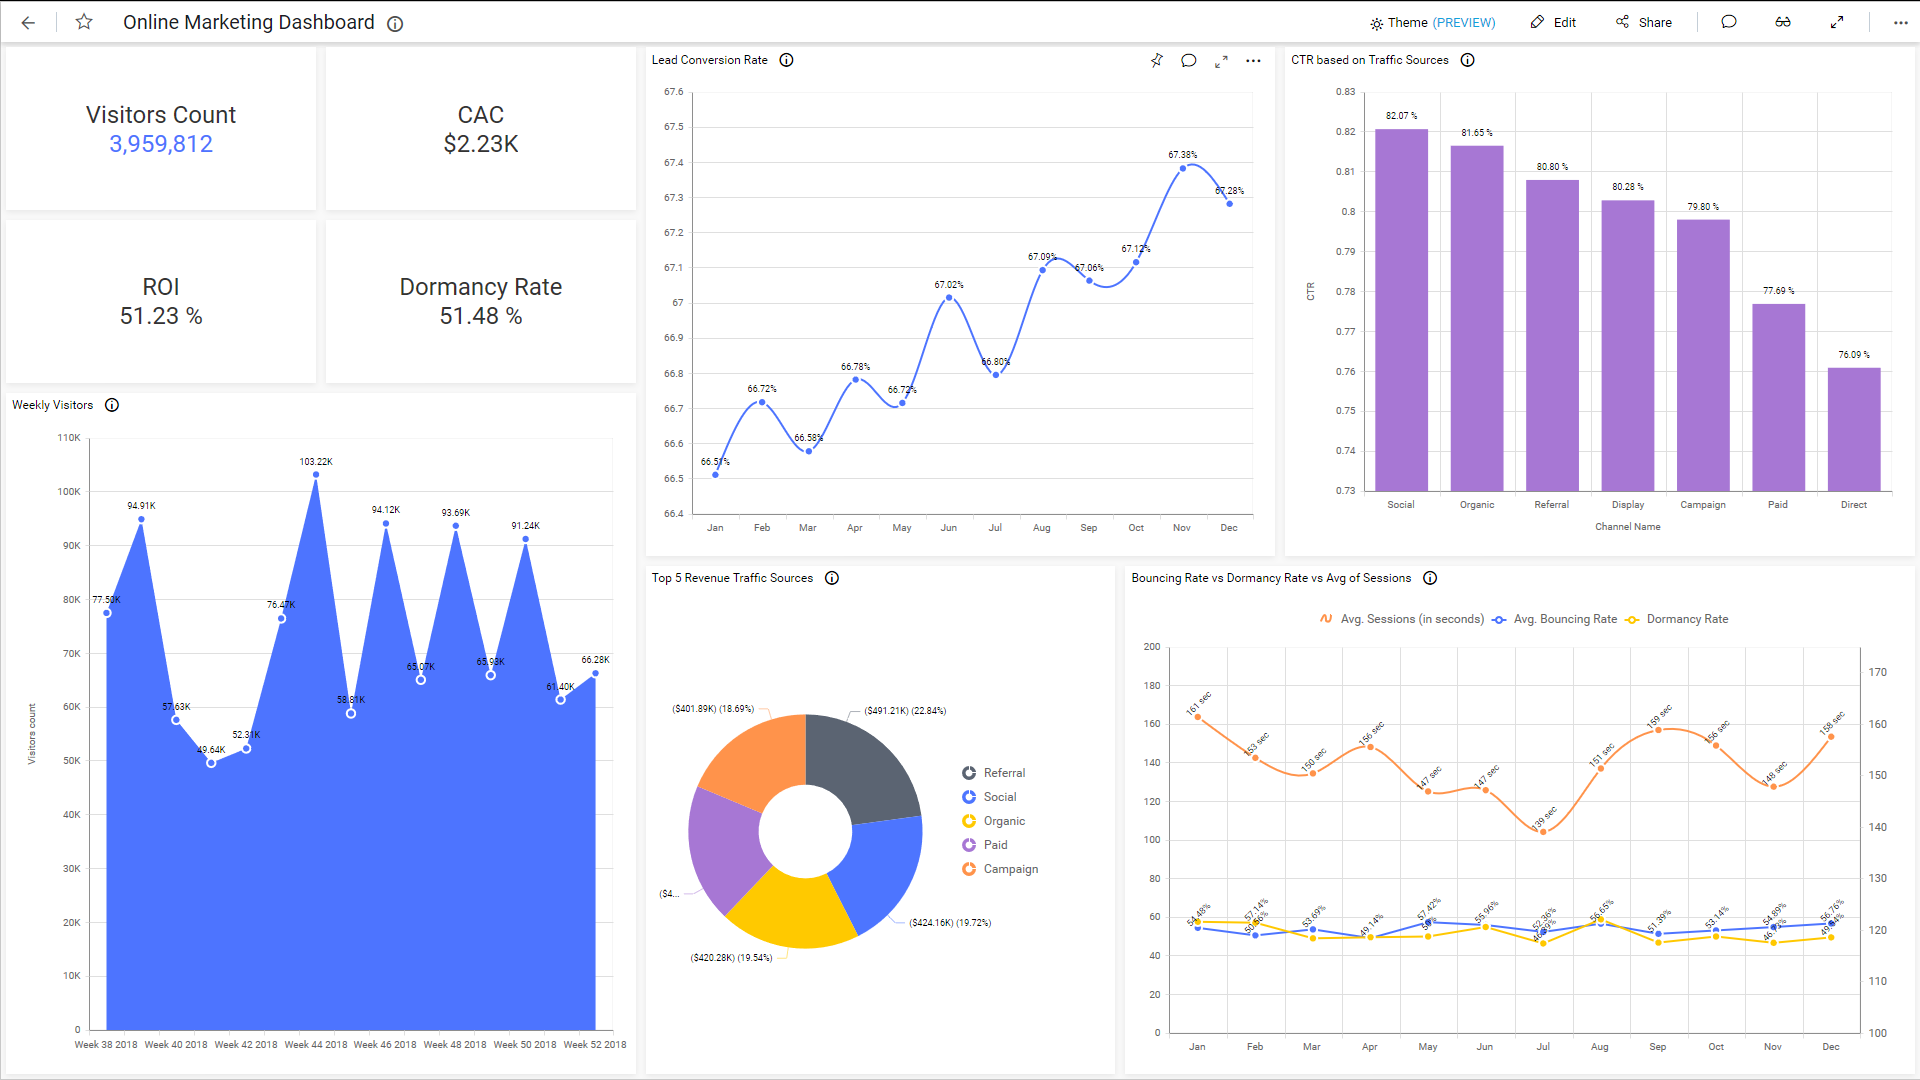
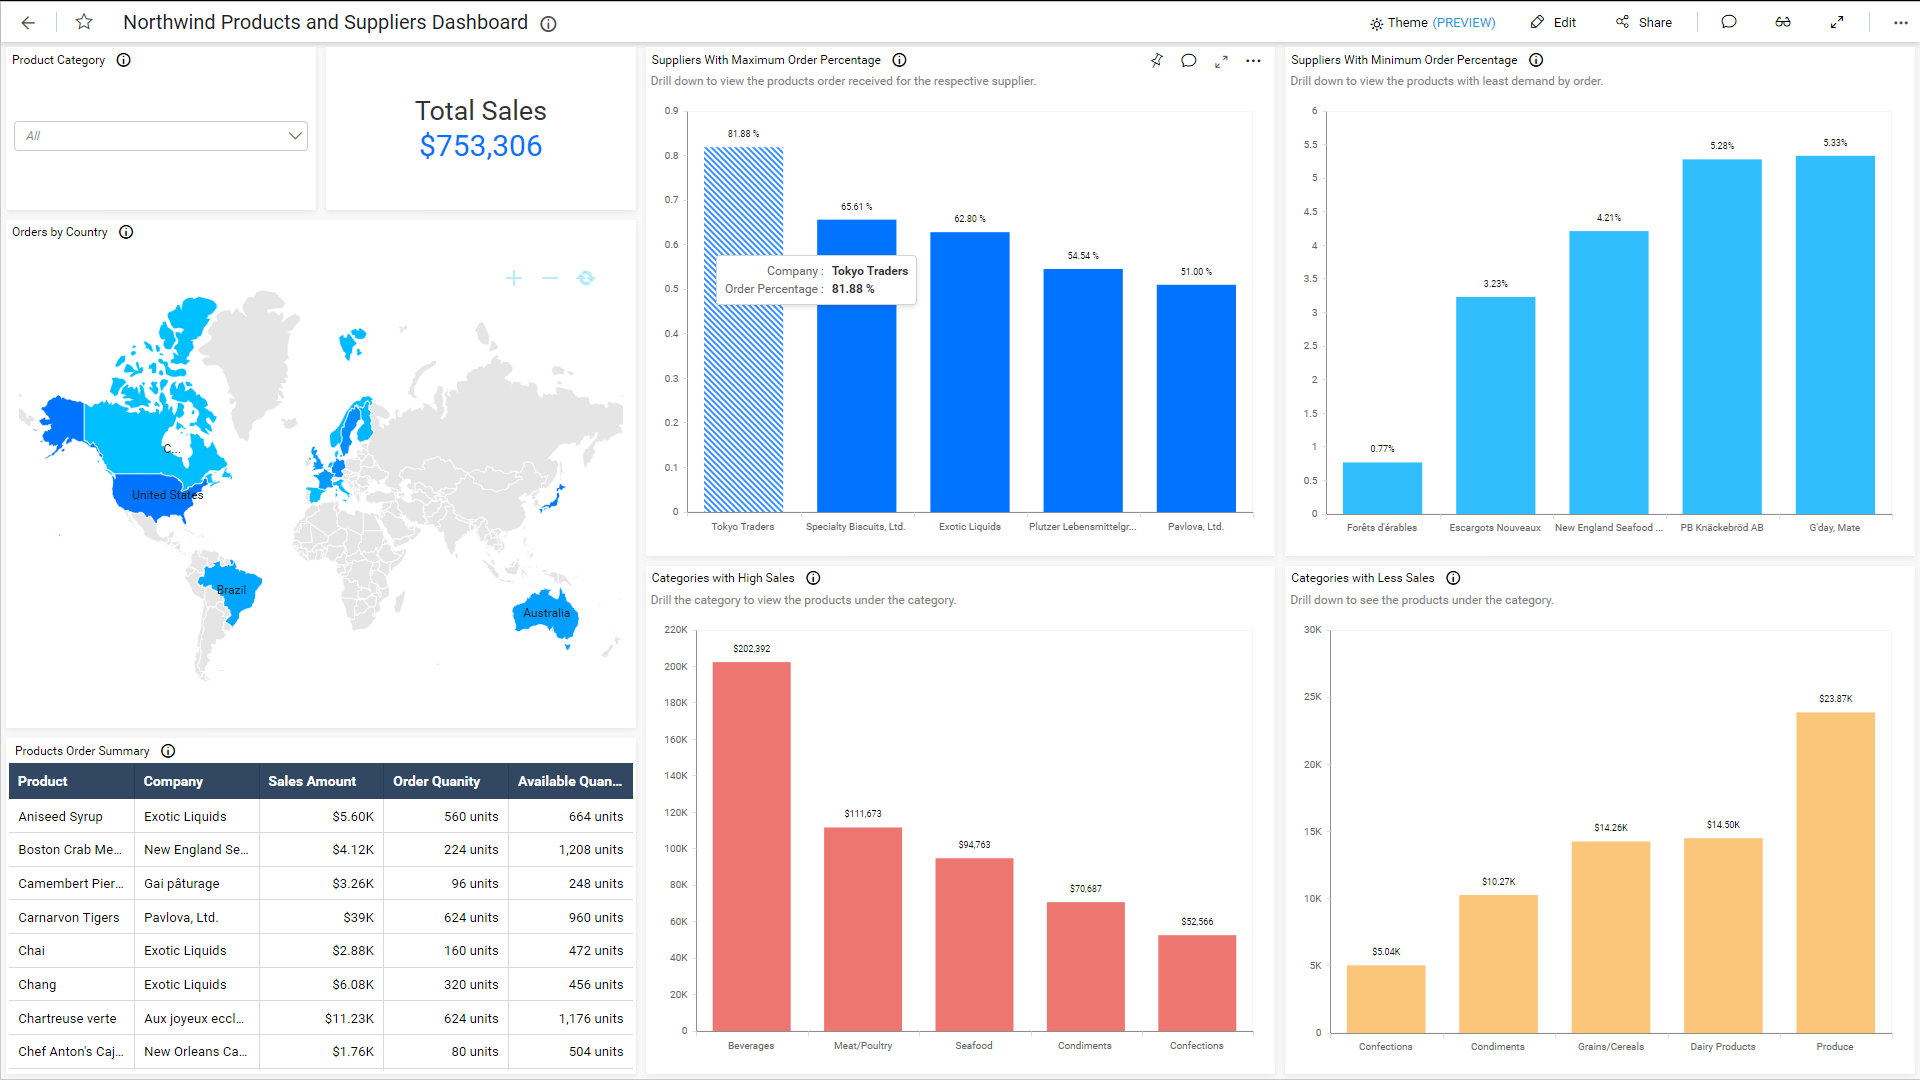
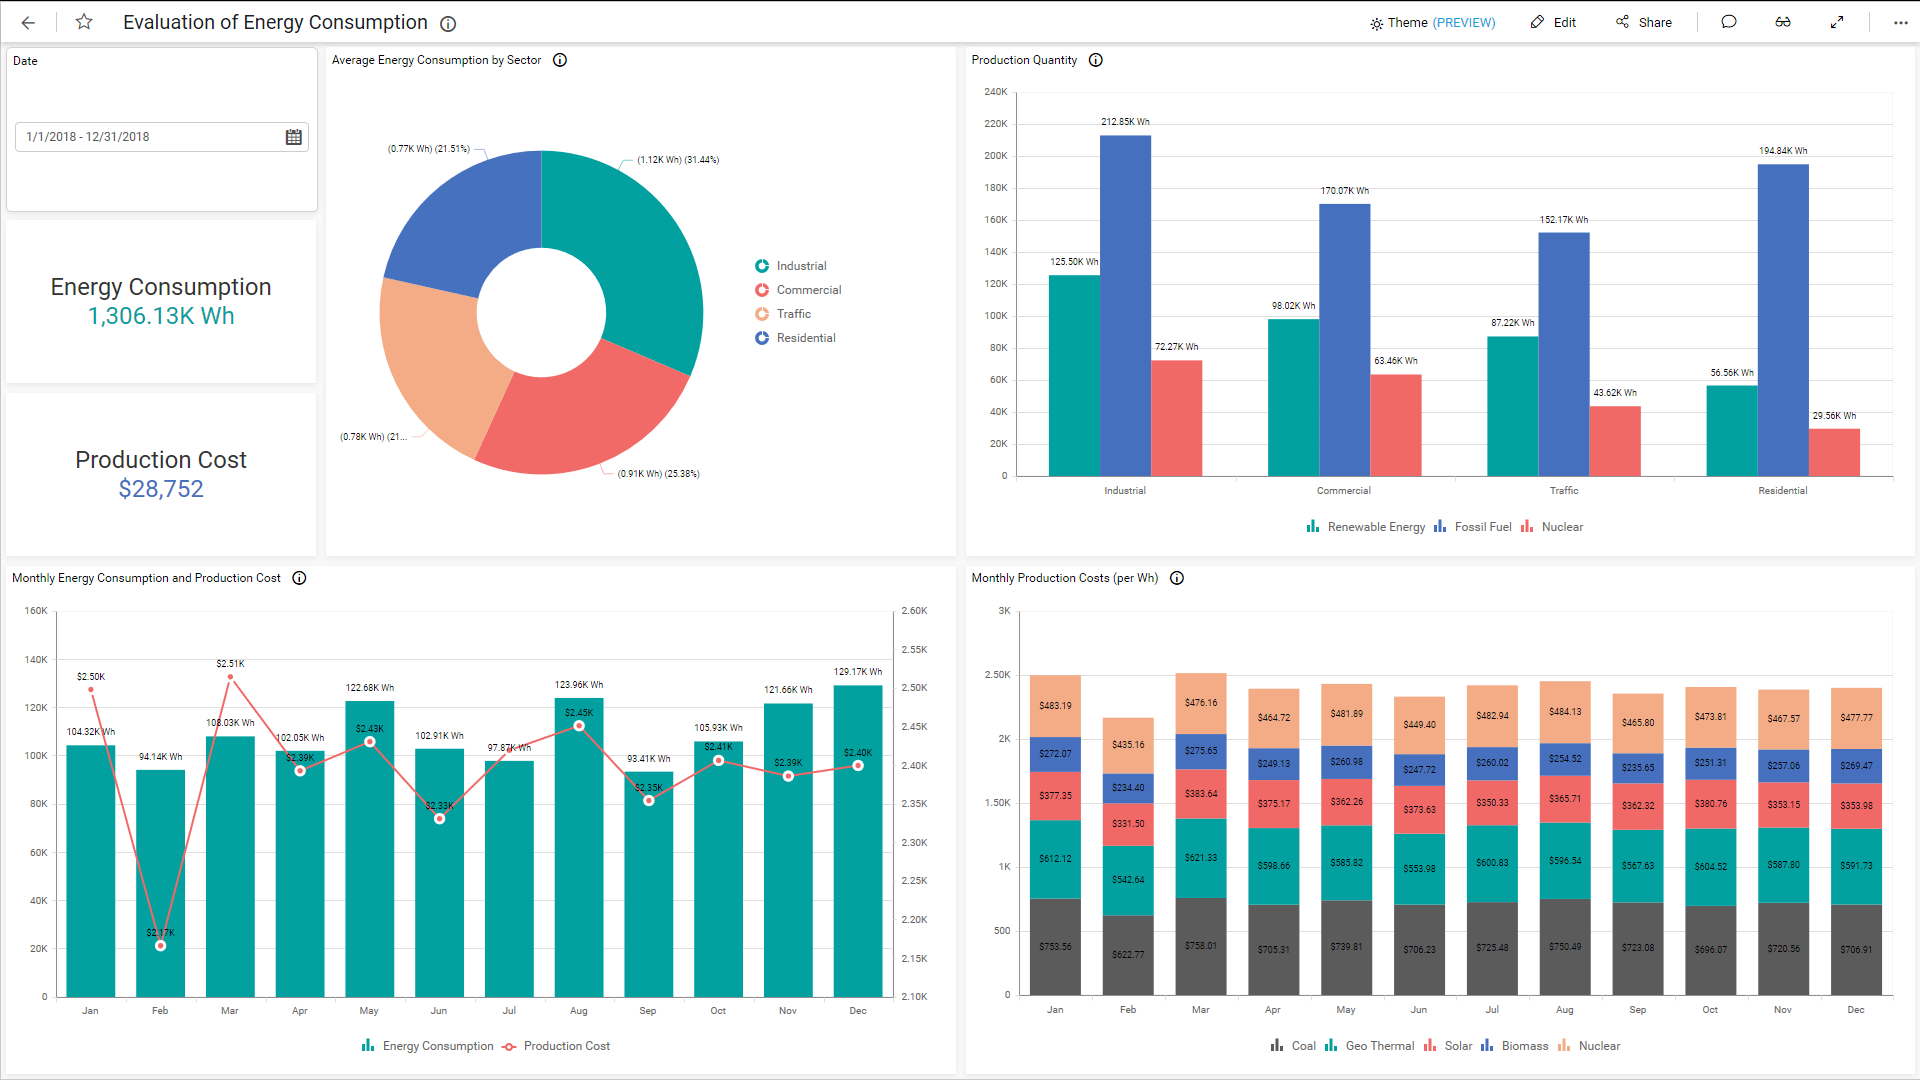
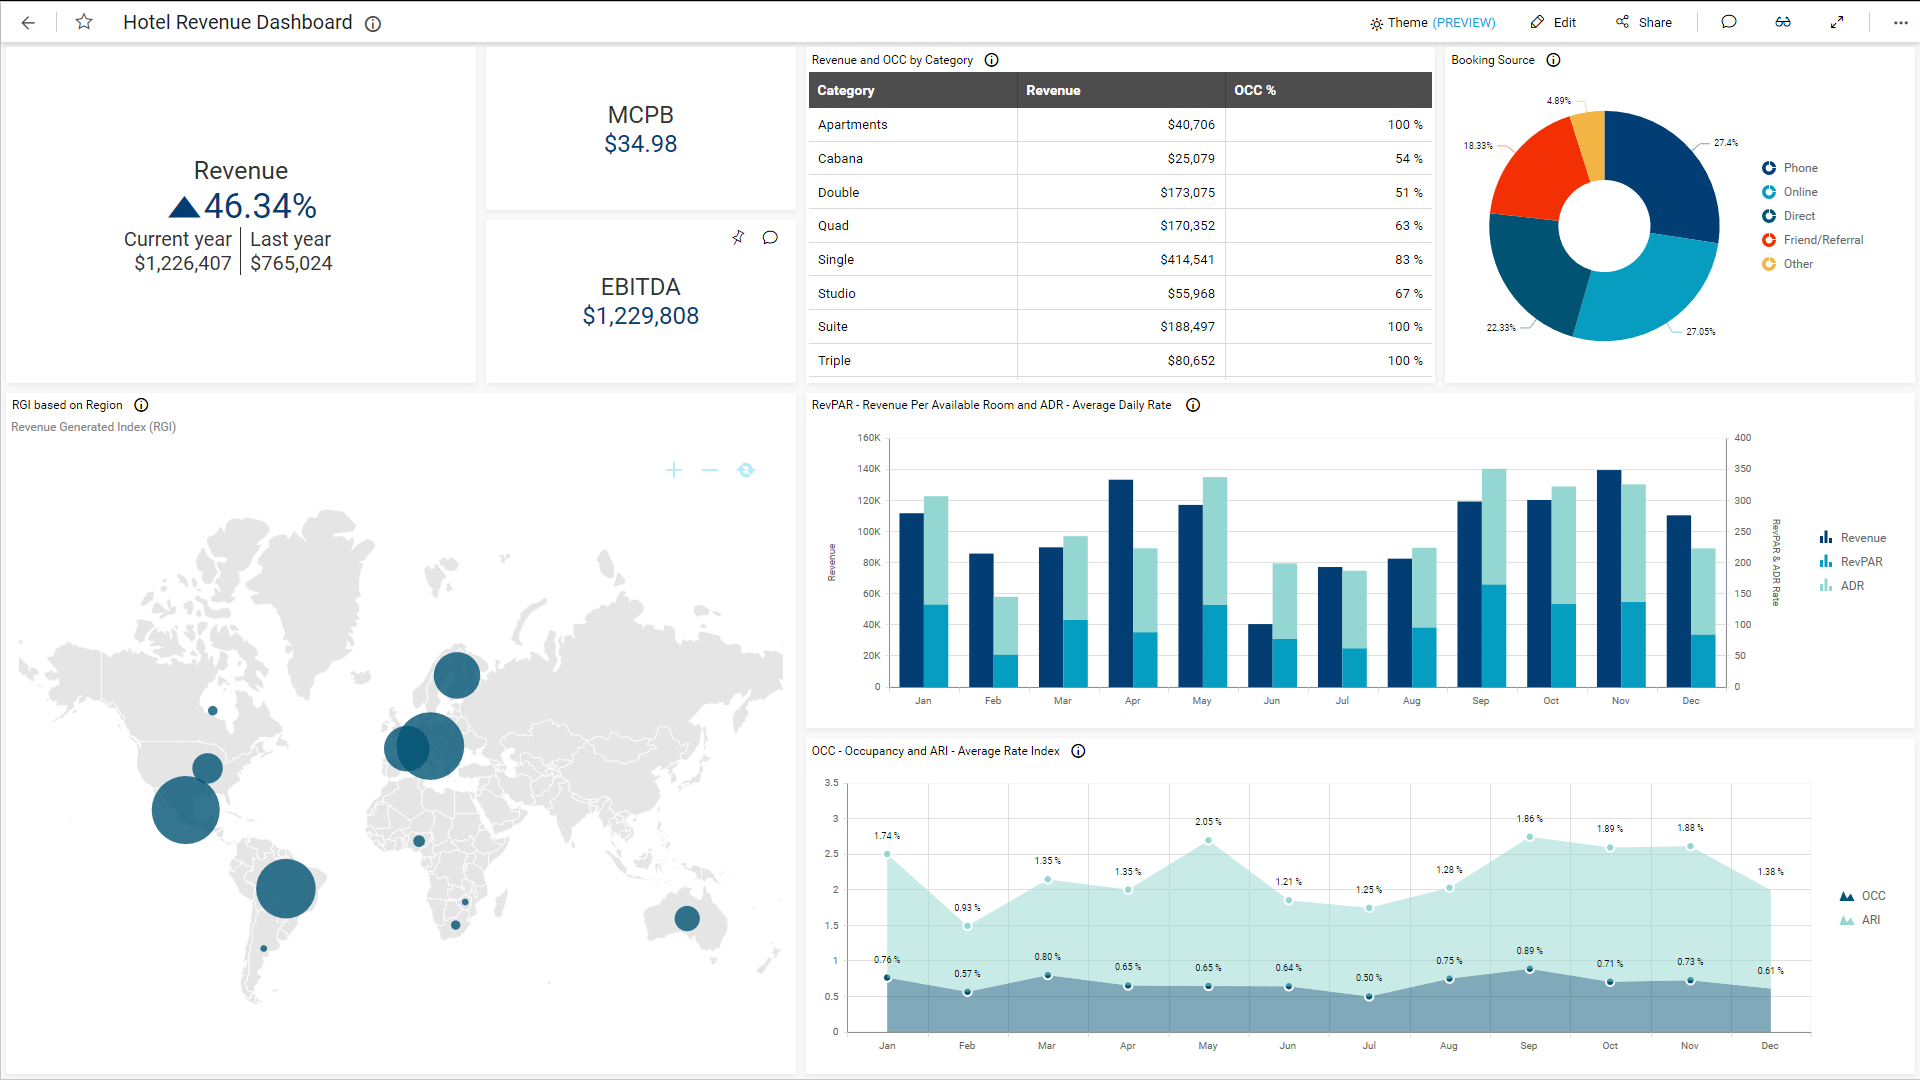
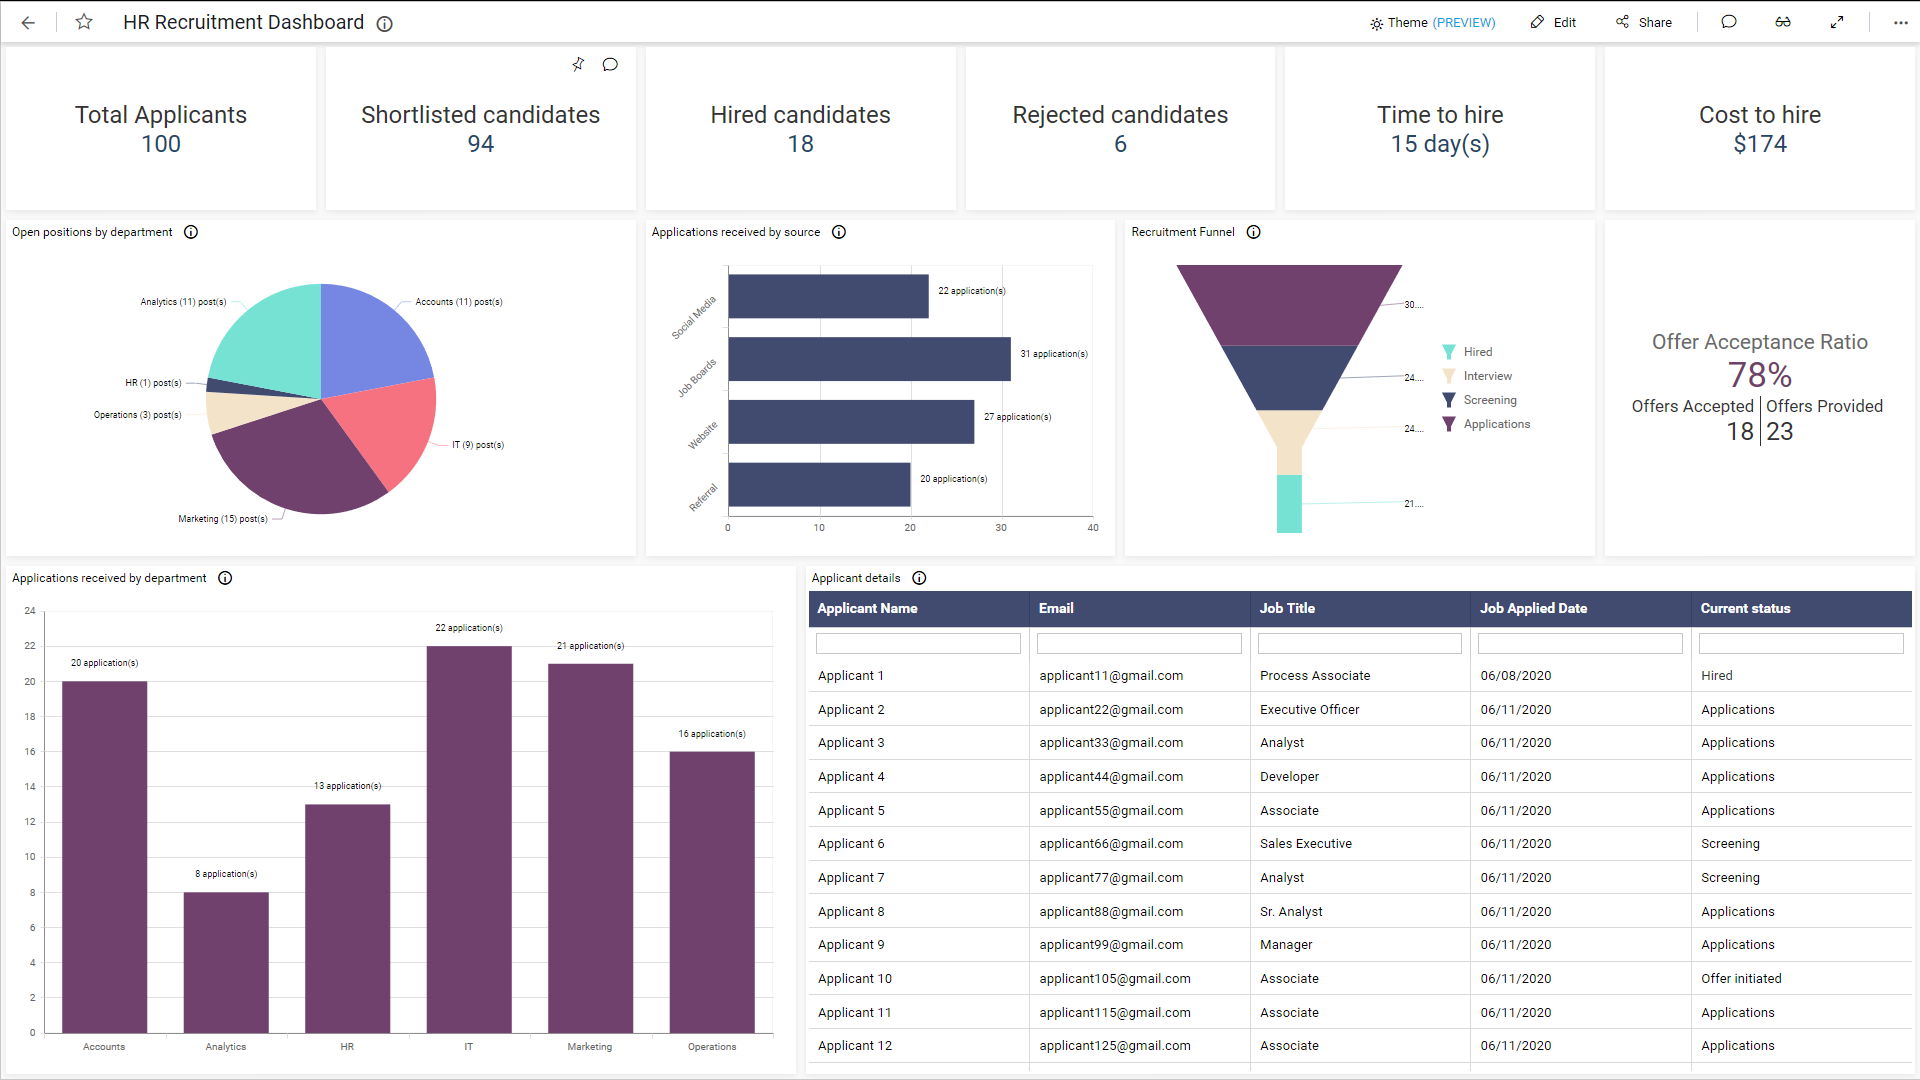
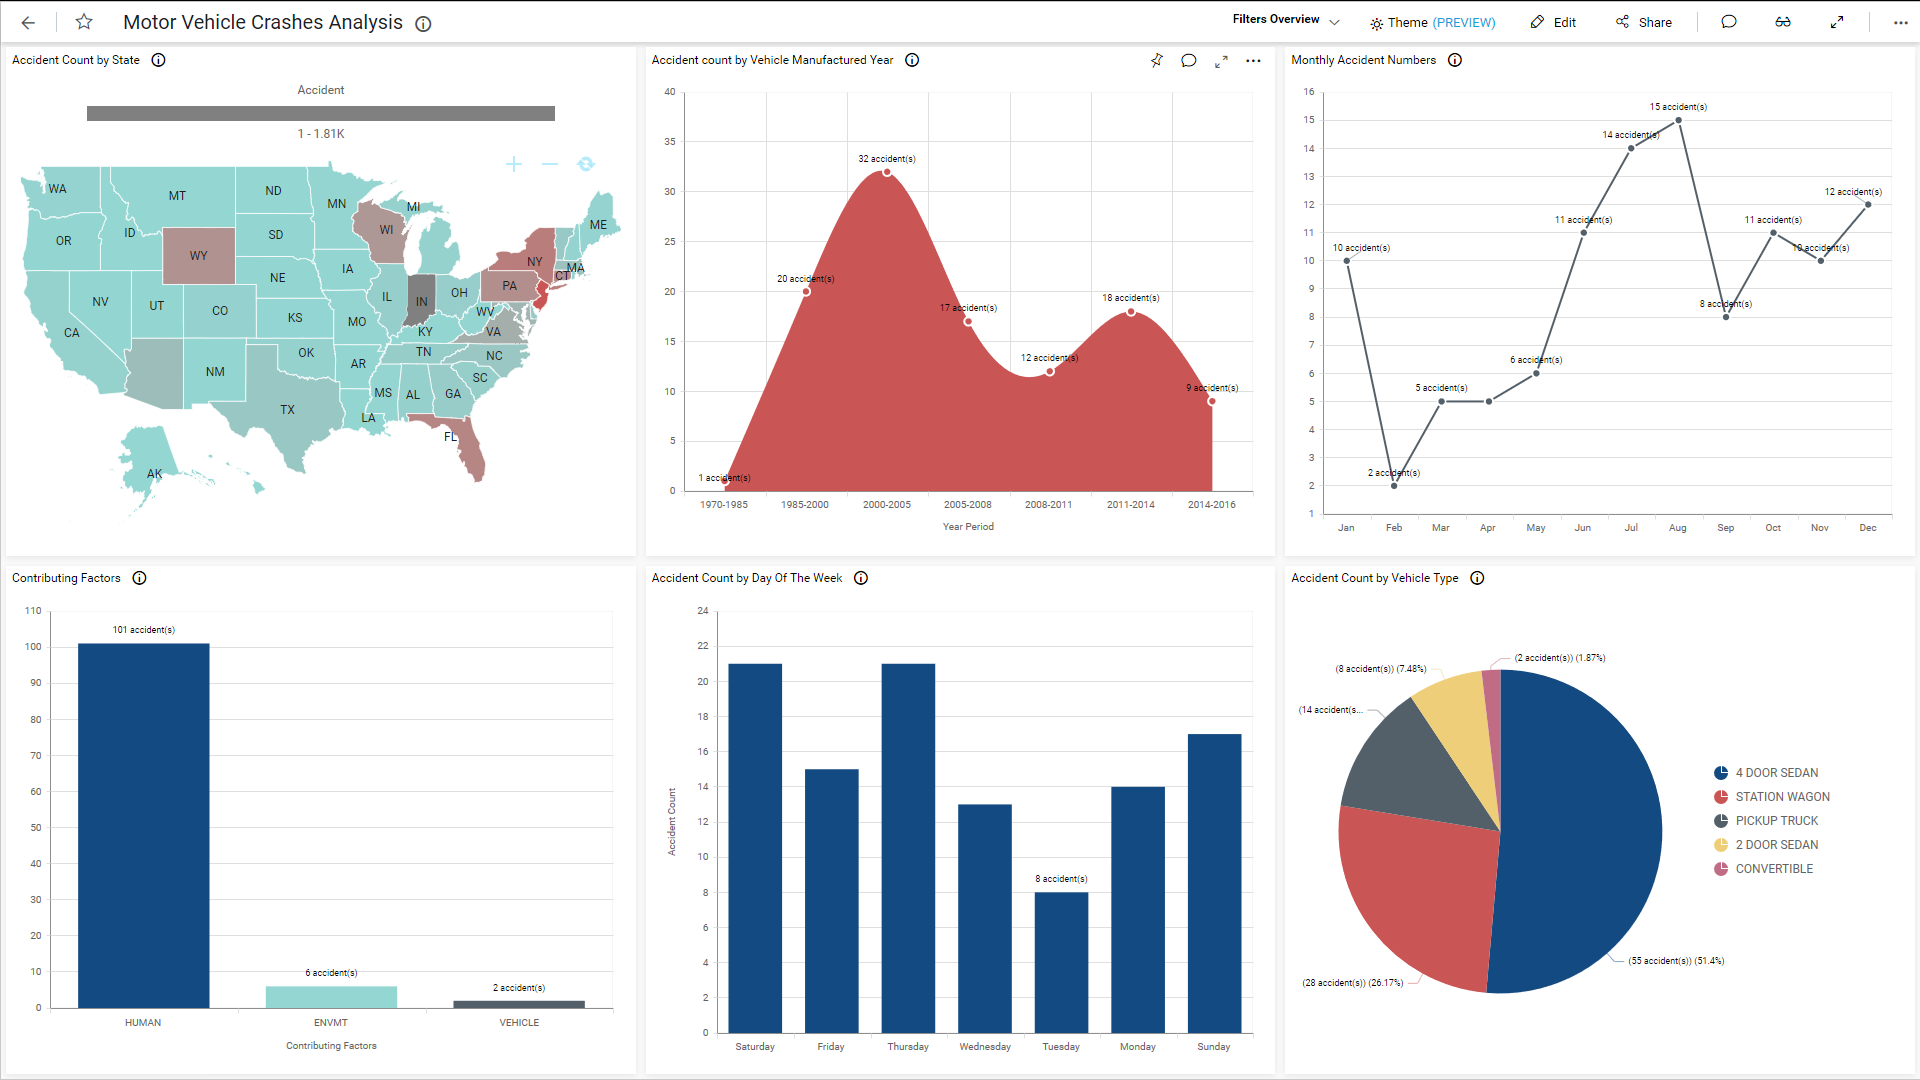
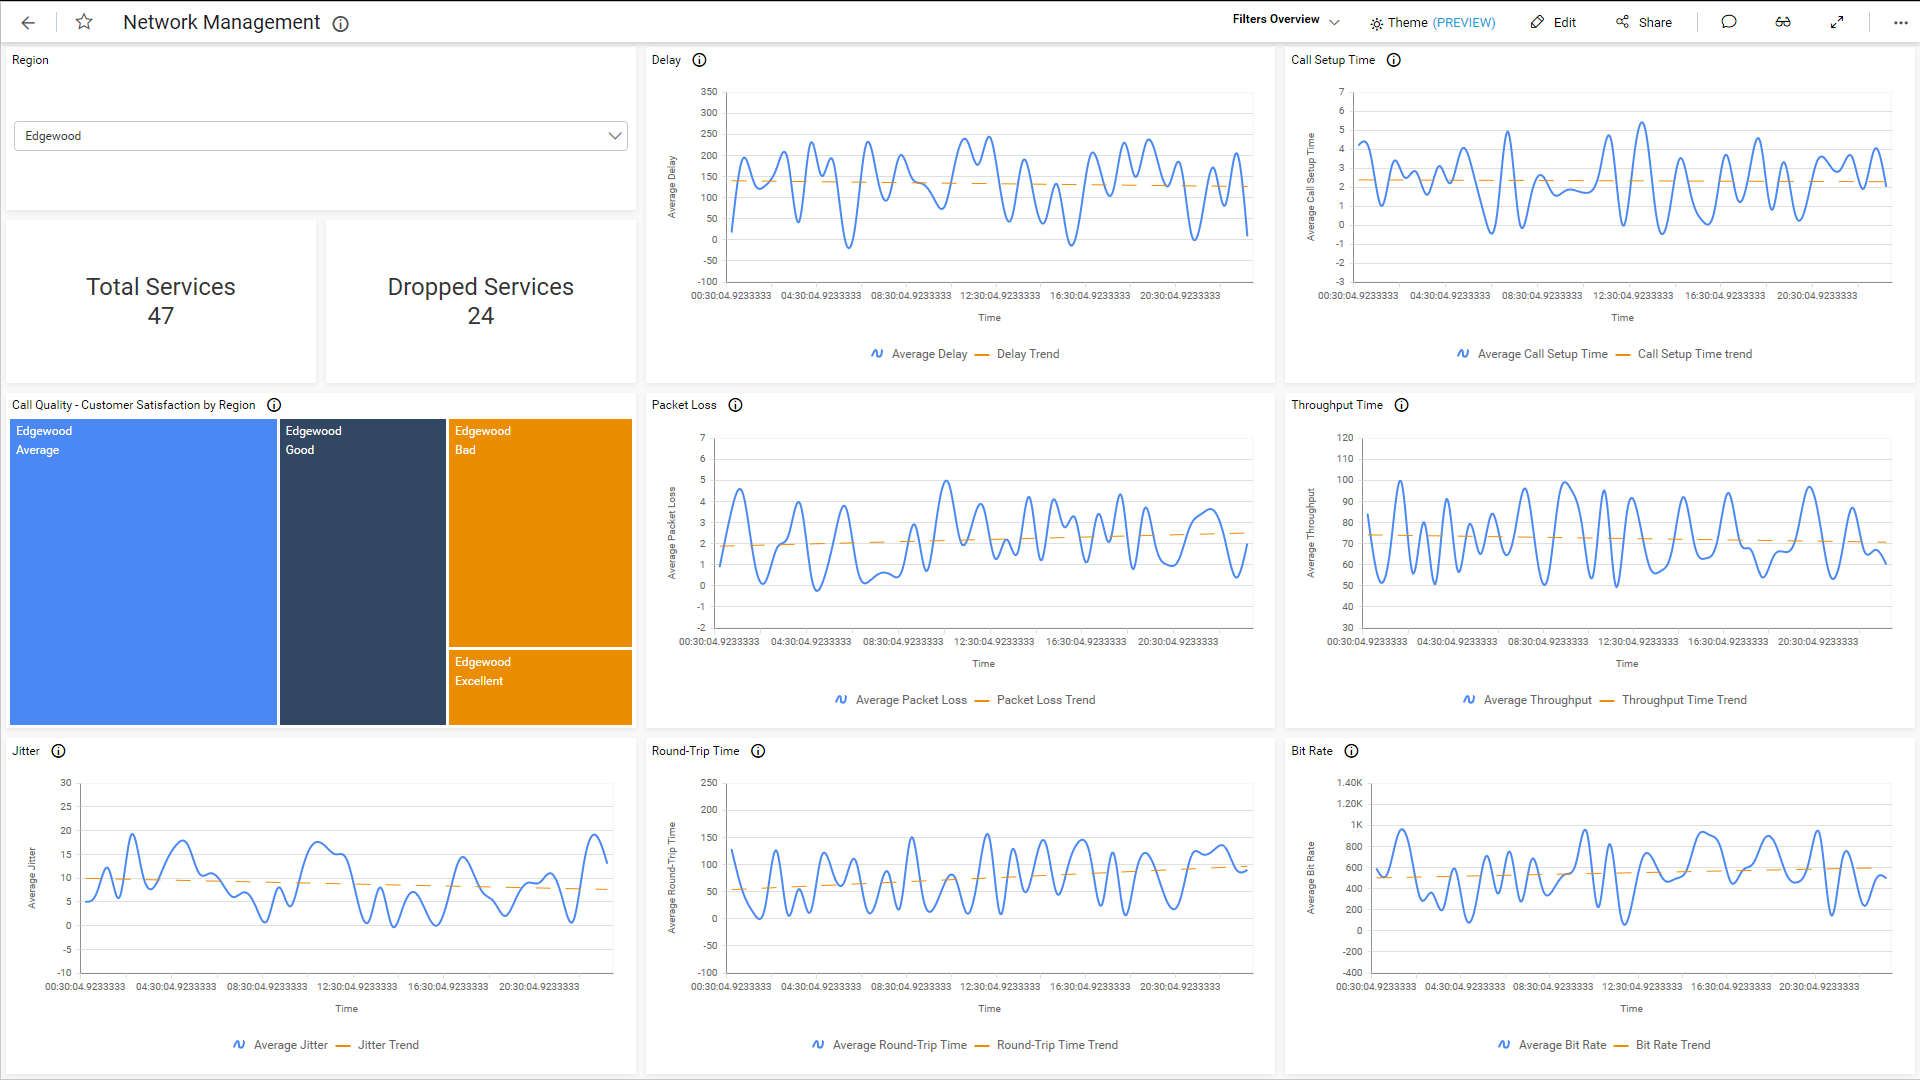
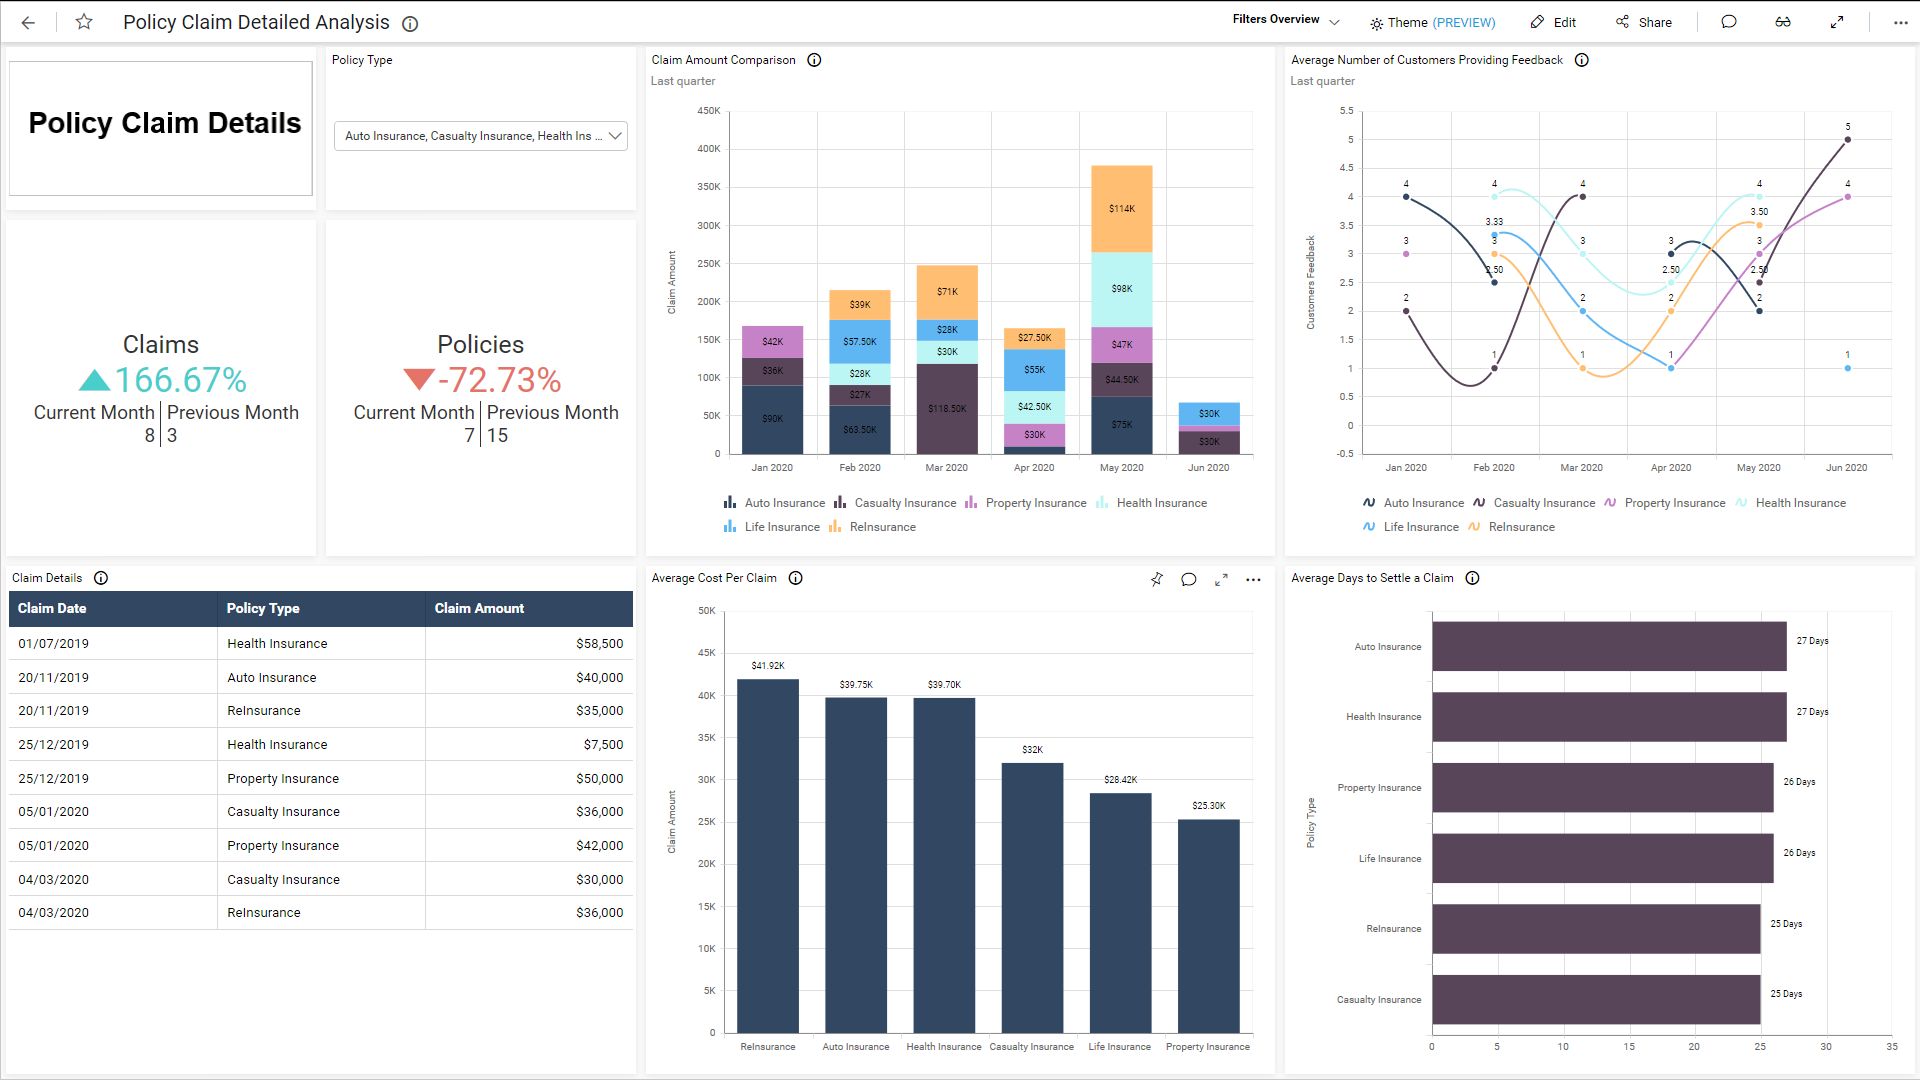
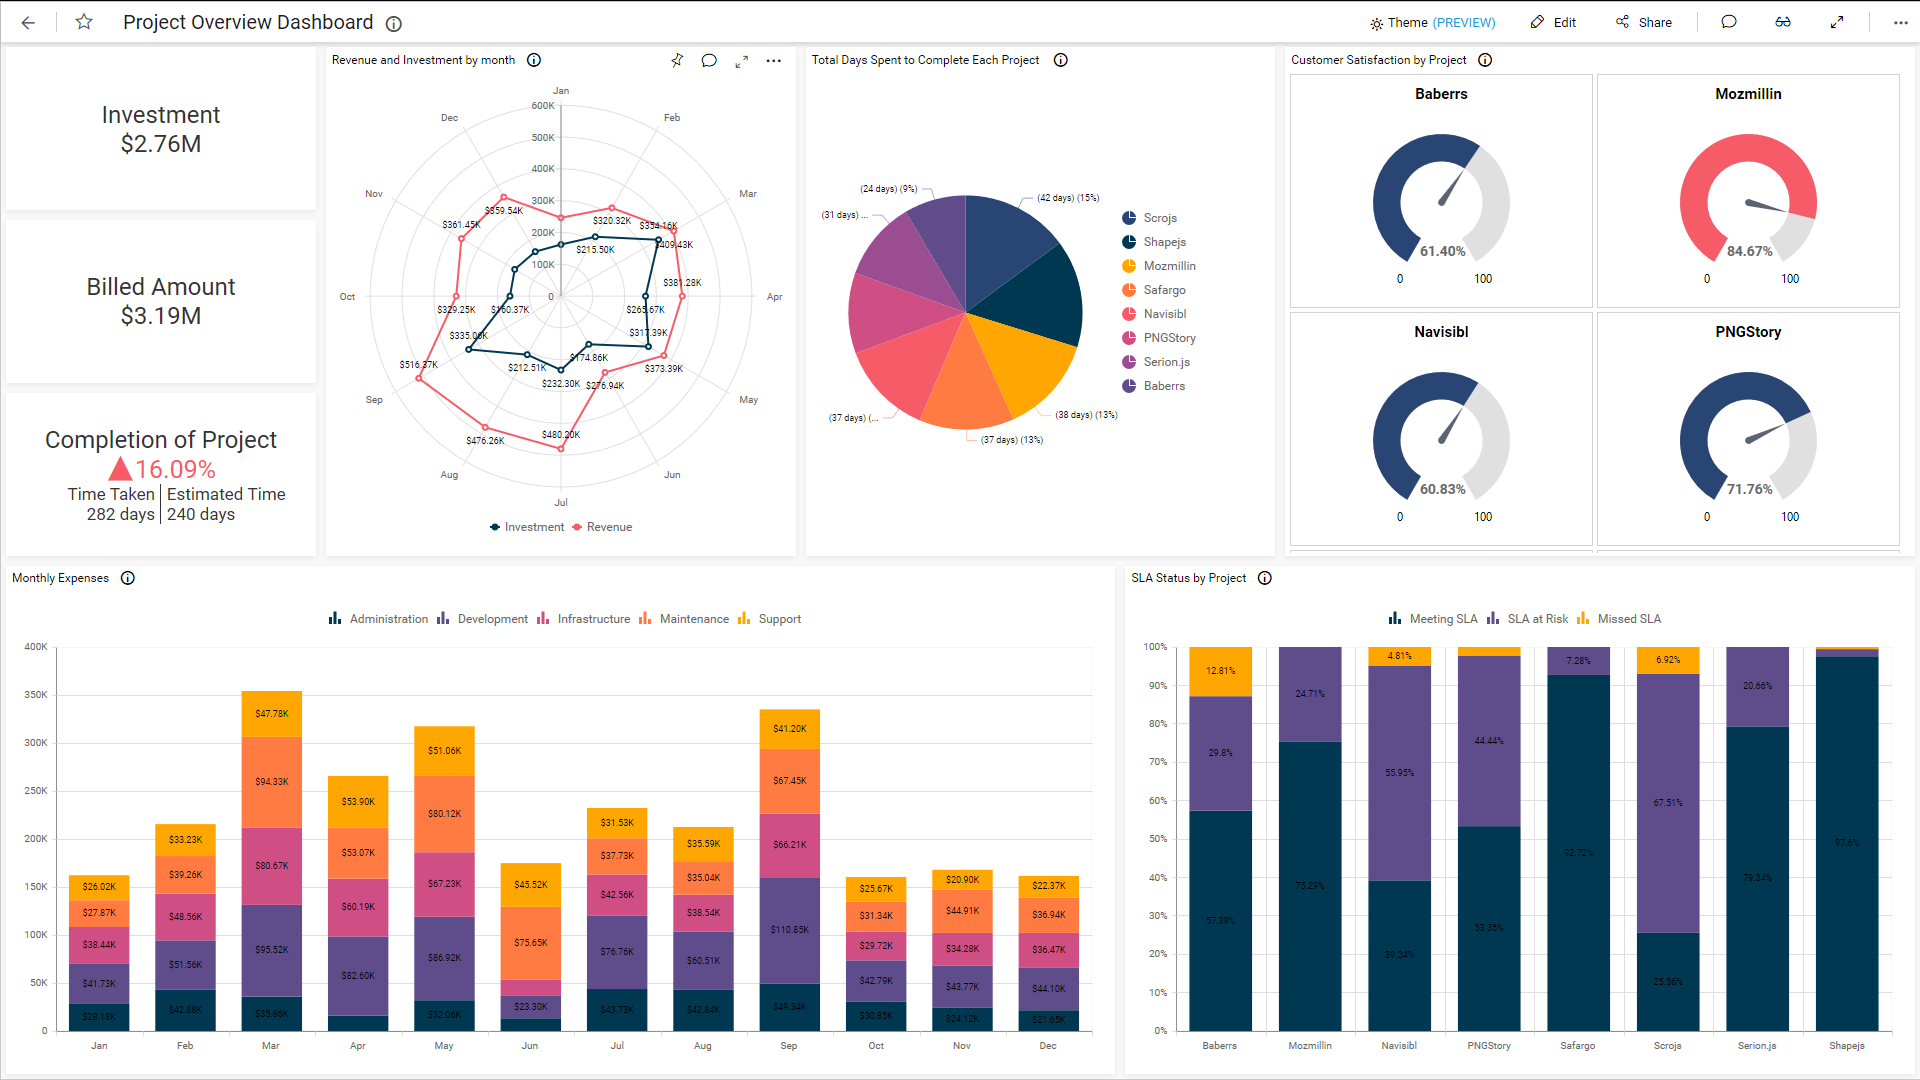
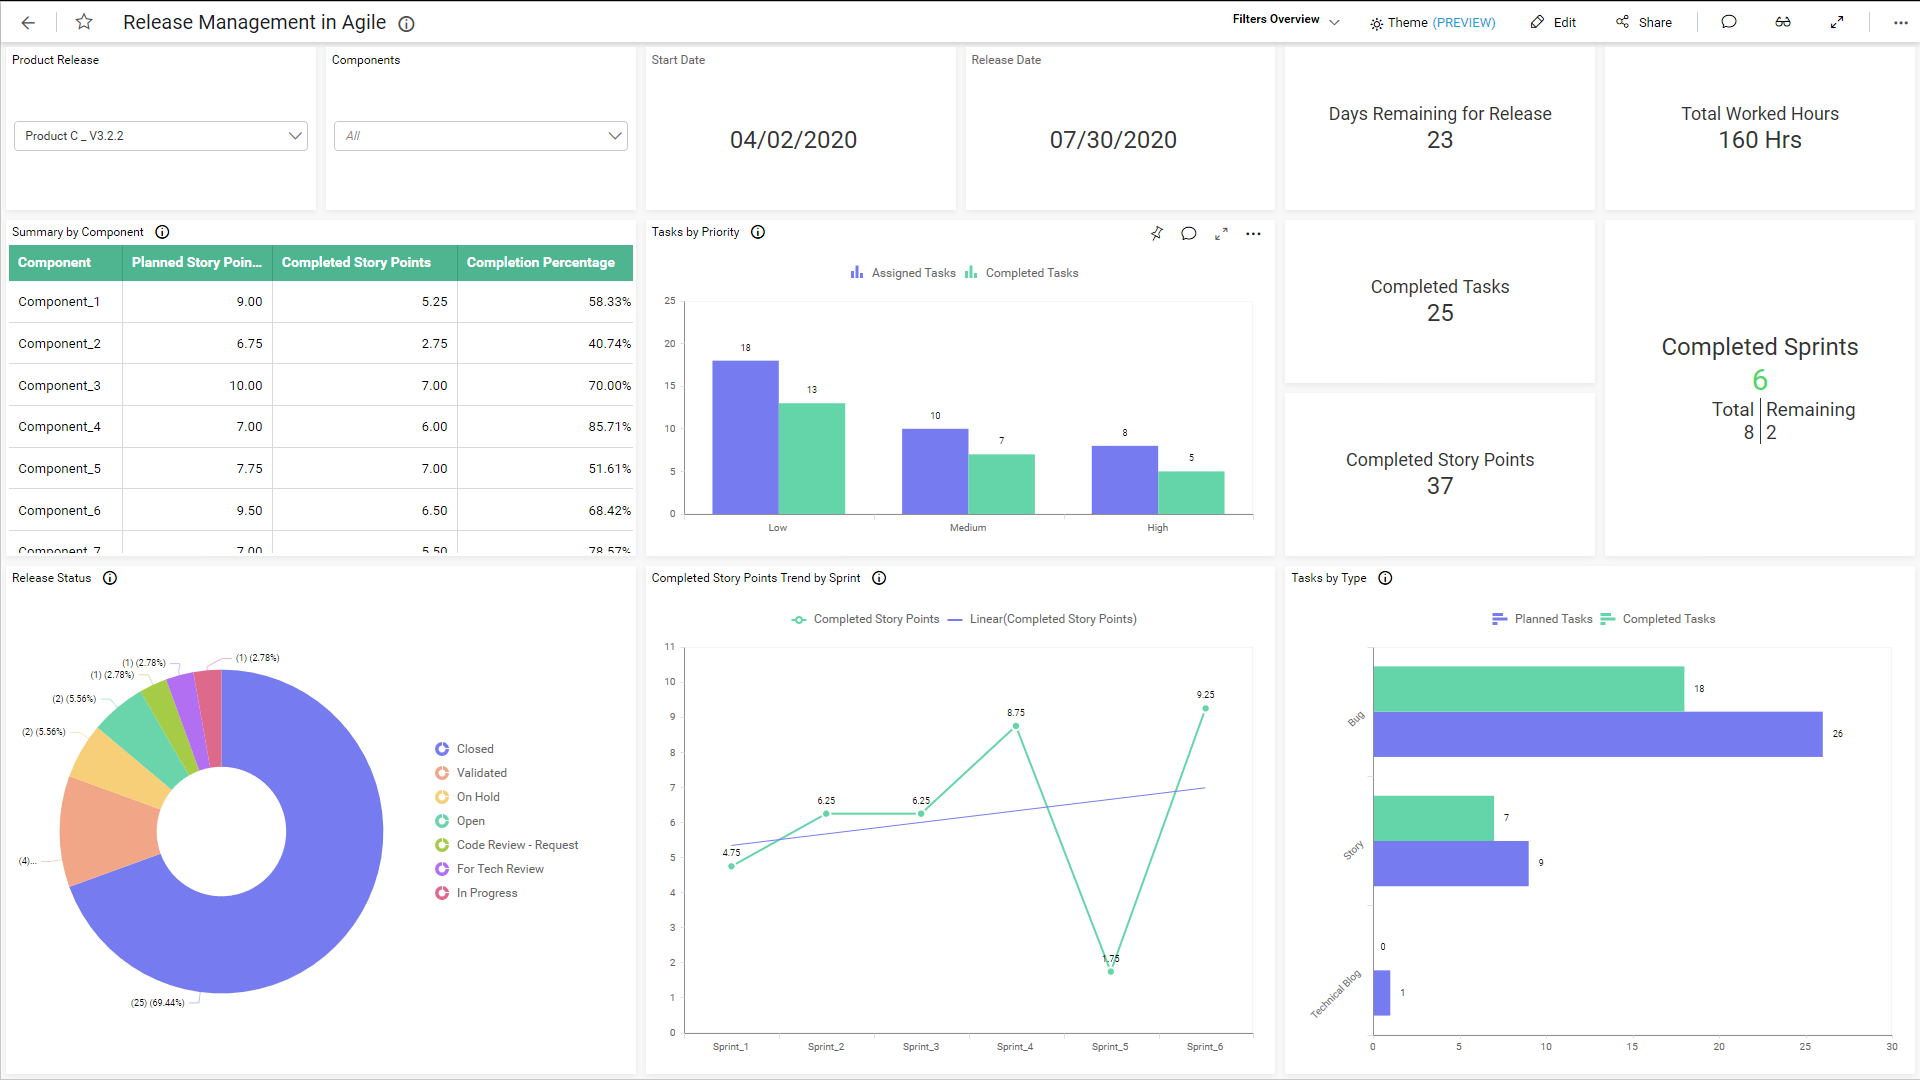
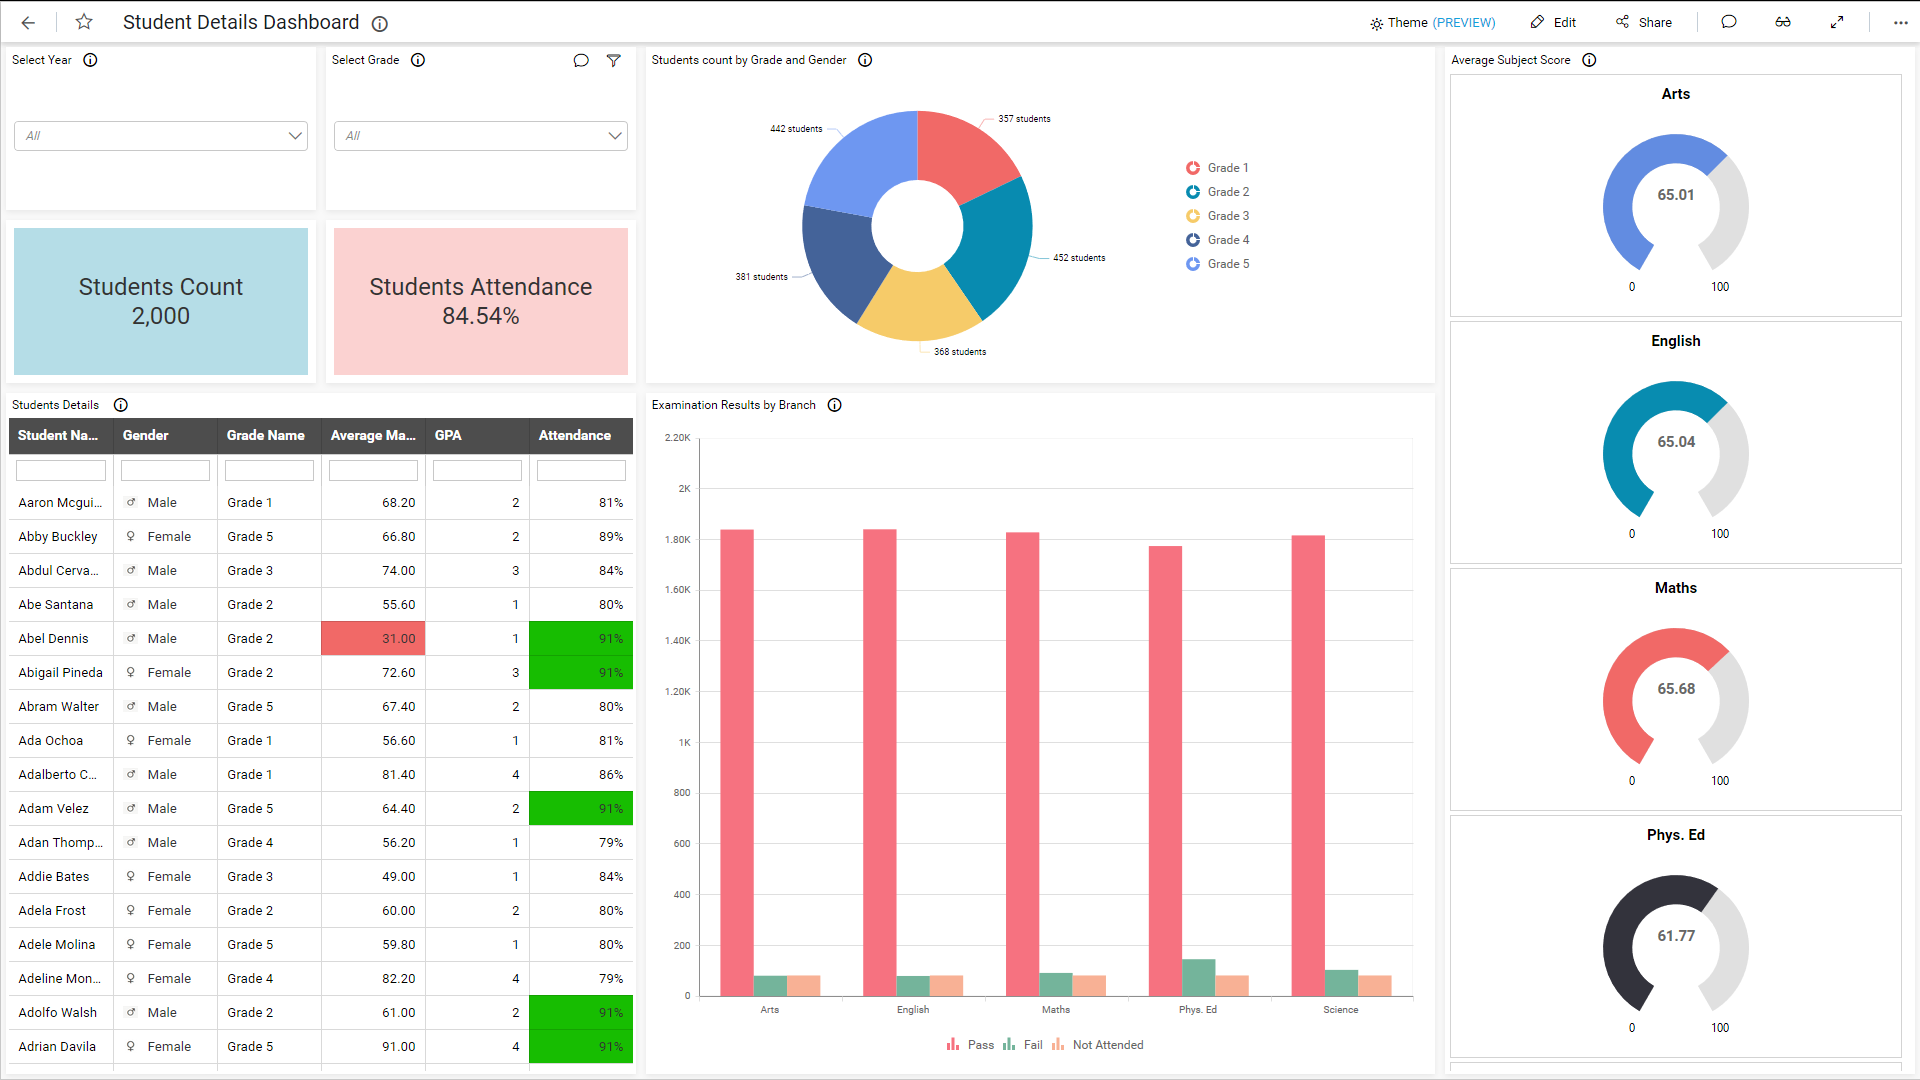
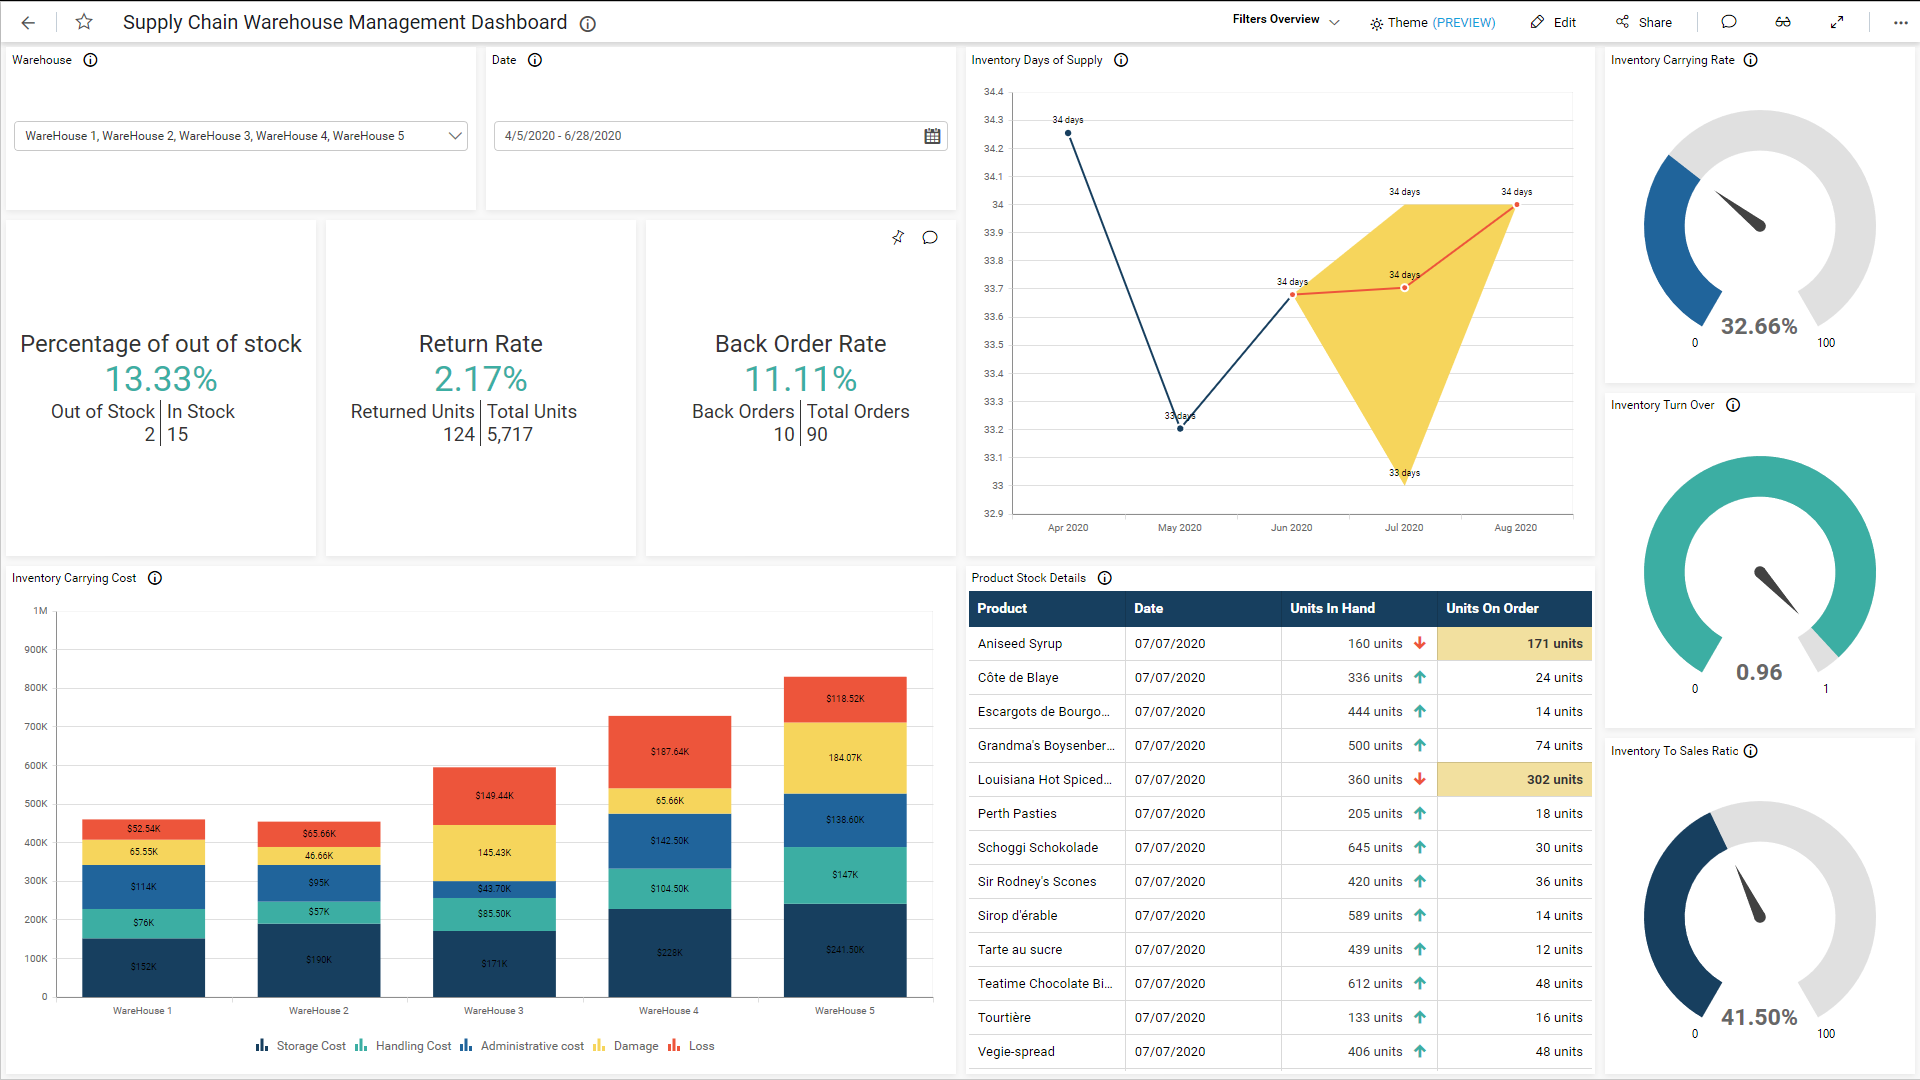
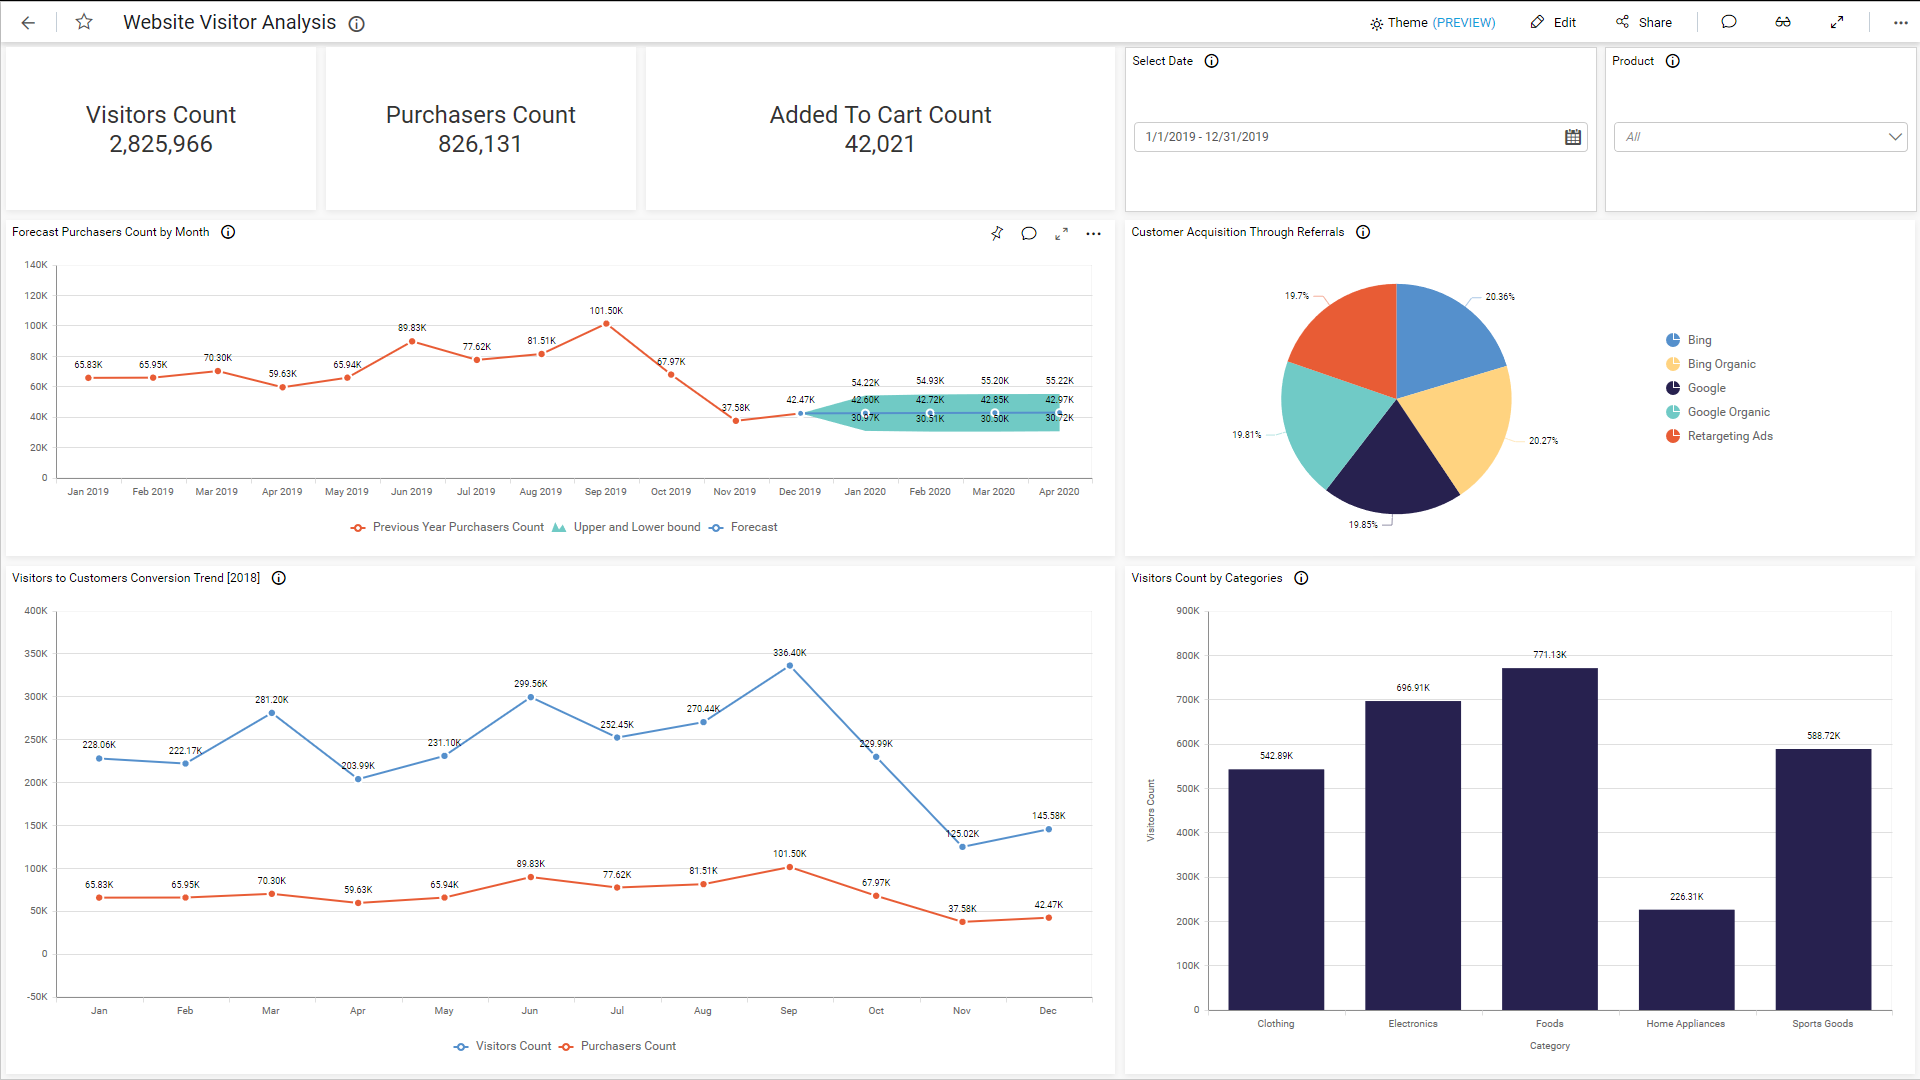
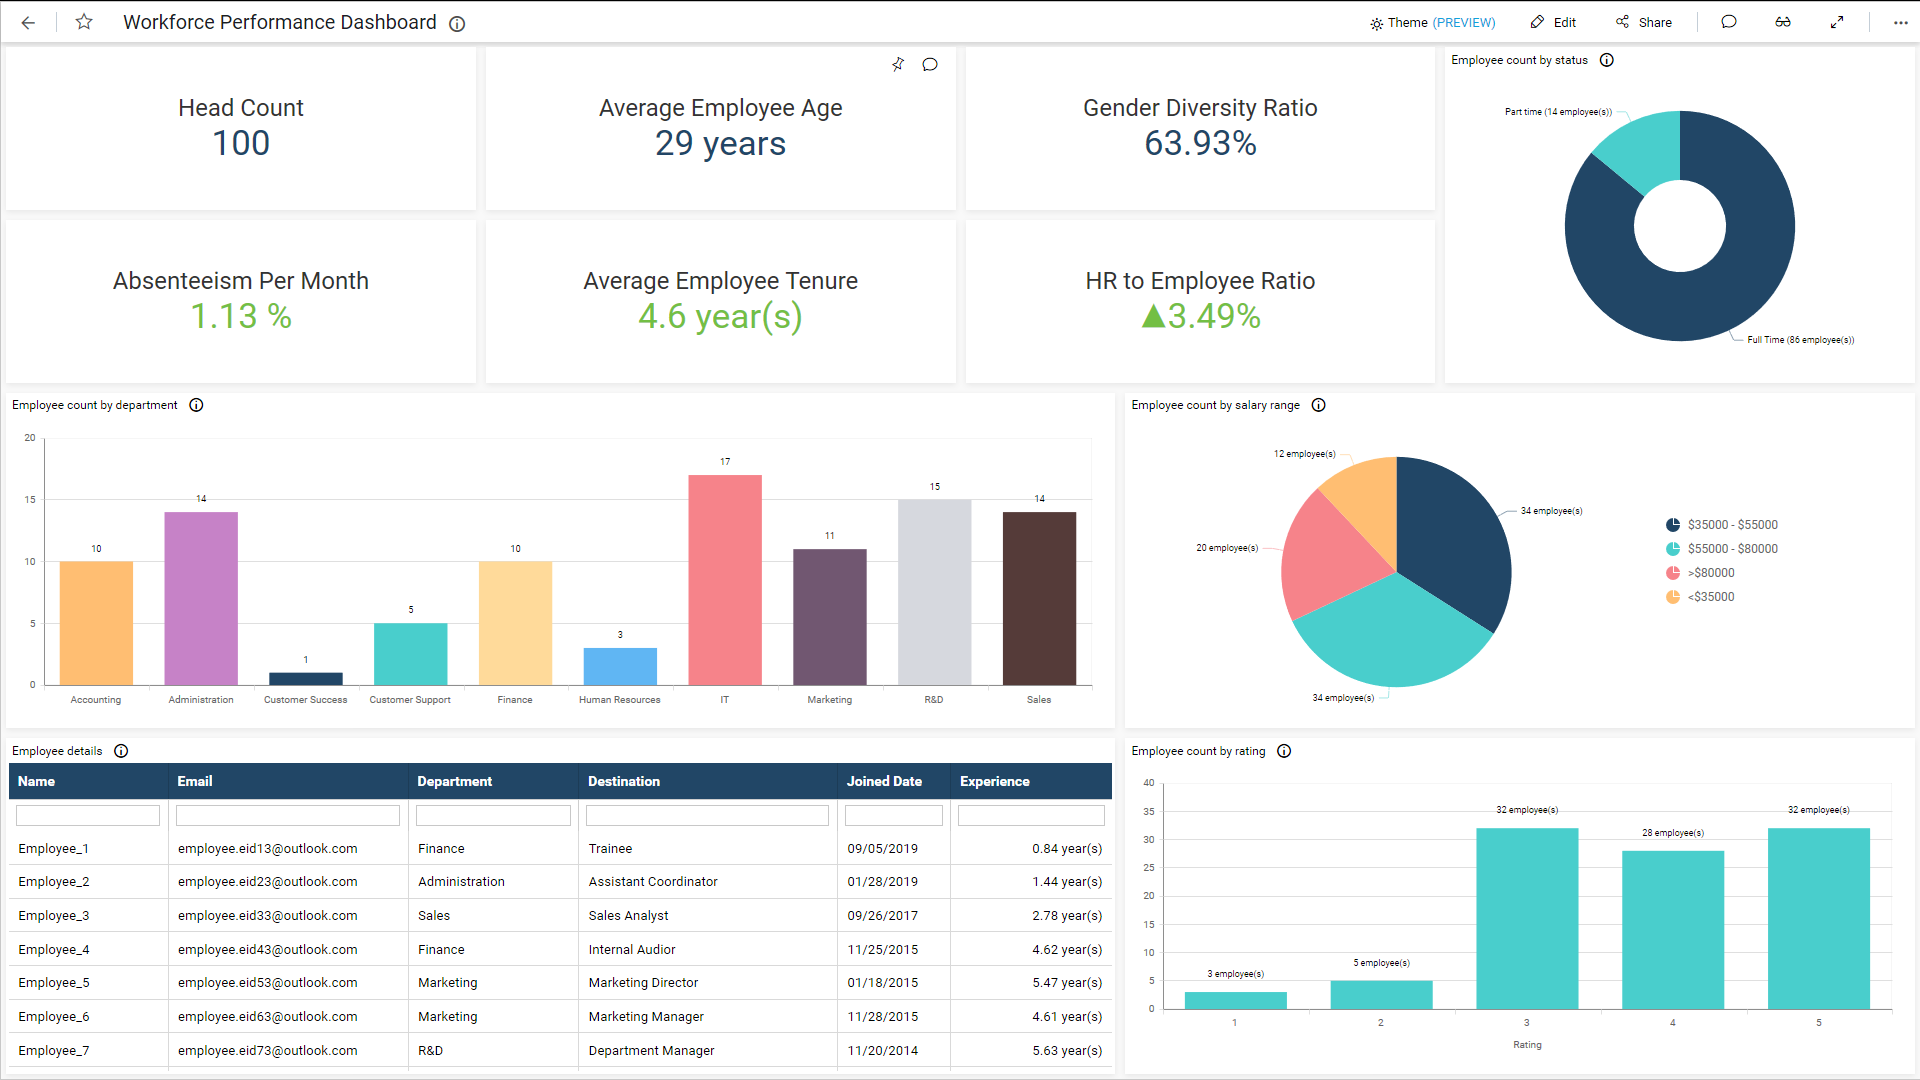
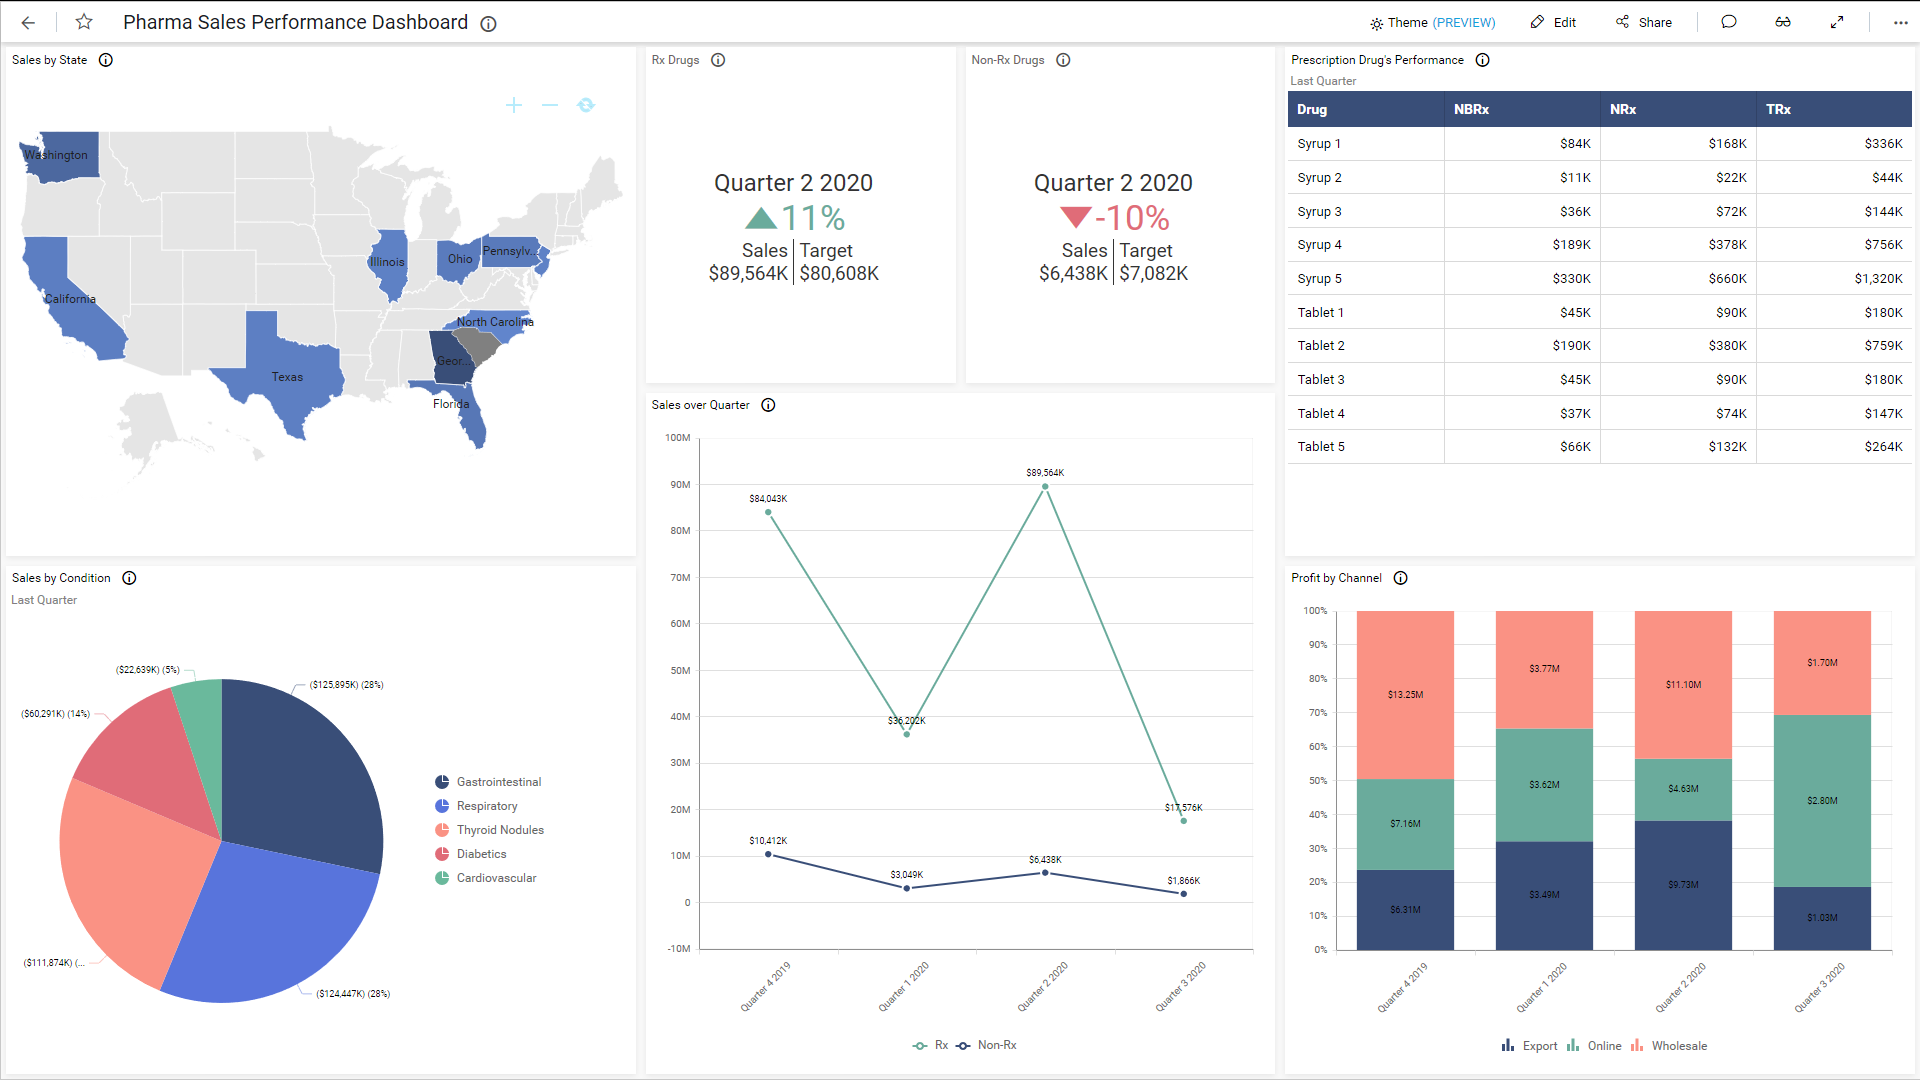
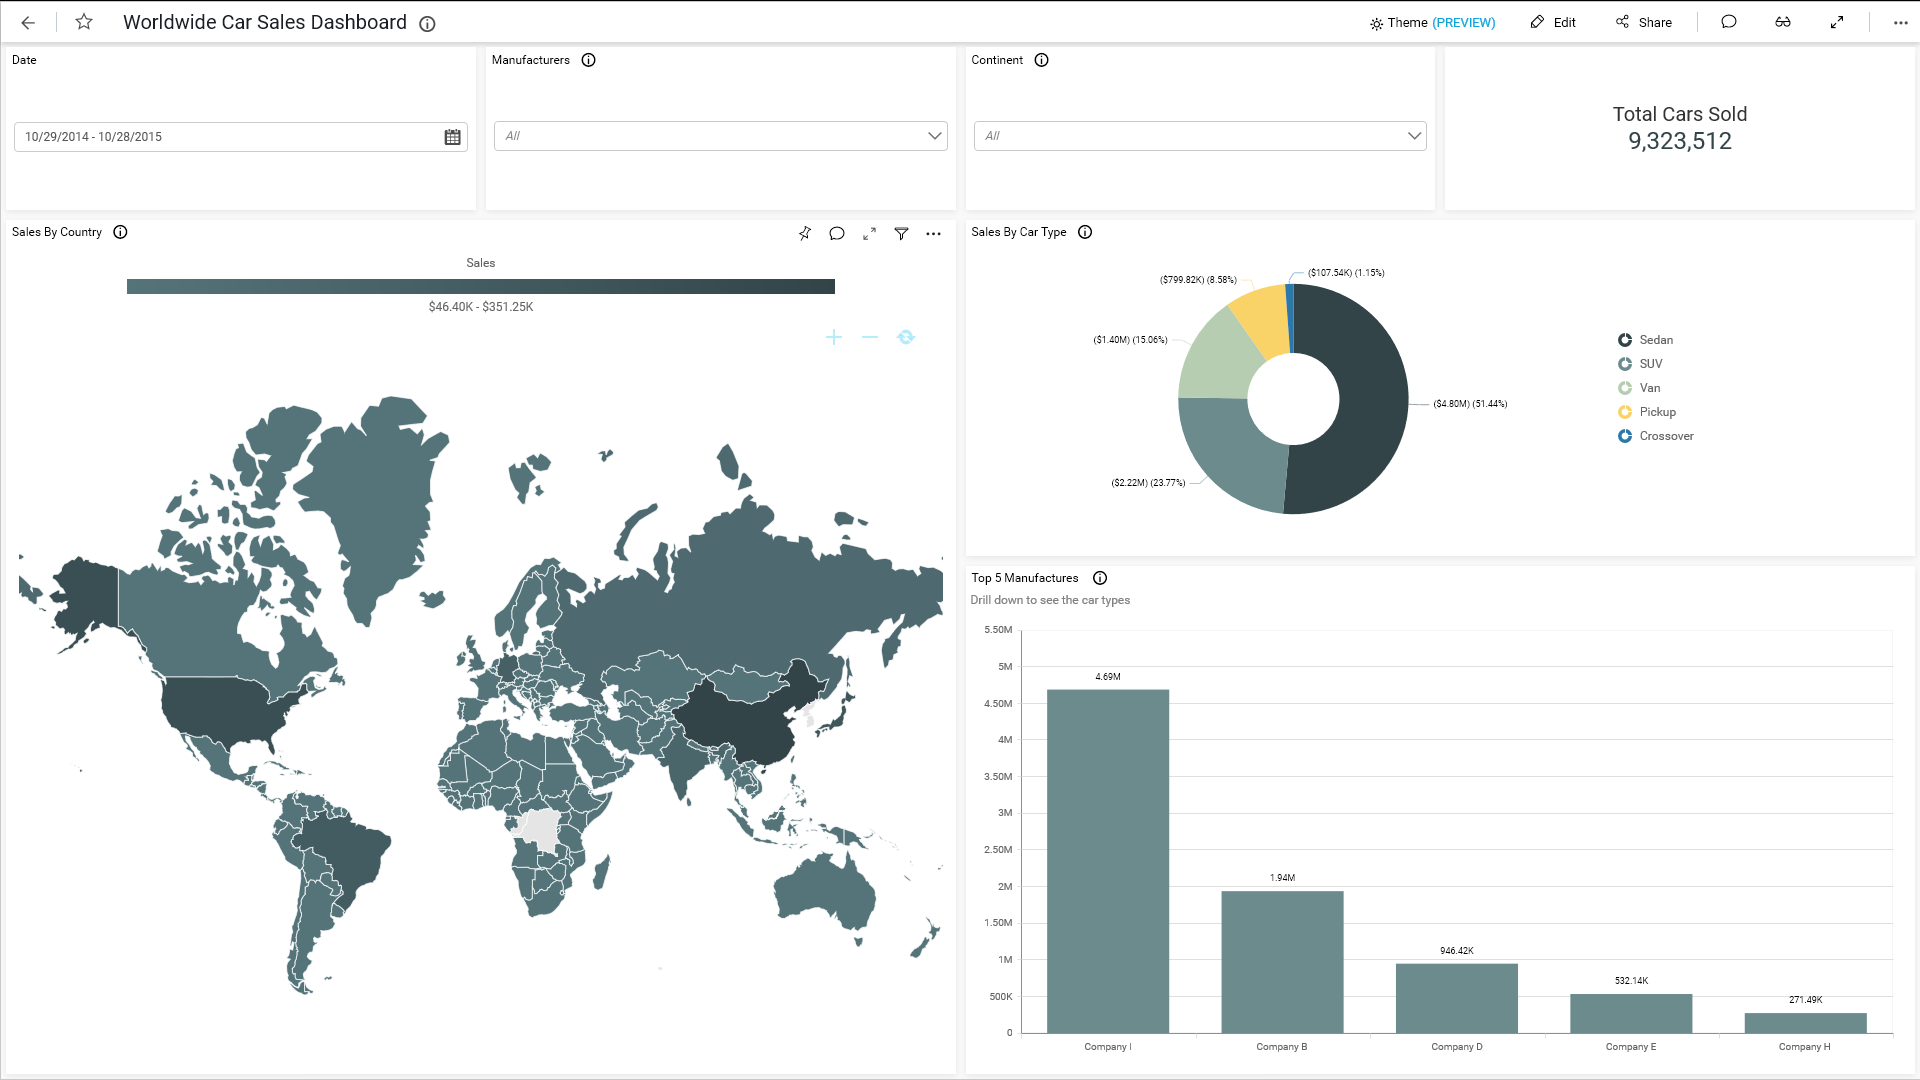
We’ve put together a collection of DataSnare Sample Dashboards using various widgets to demonstrate how a Datasnare Report Server Subscription can help organize and visualize your data. Check out how the examples use grids, pie charts, bar graphs, heatmaps, line graphs, combo charts, KPI cards, choropleth maps, date and data filters, and more to make sense of large amounts of data. All these DataSnare Sample Dashboards were created from the web-based Datasnare web designer, which is included in each Datasnare Report Server Subscription.
With Datasnare, creating and distributing informative, interactive dashboards to manage your data has never been easier.
0
Widgets and graphs for data visualization
0
Custom Report Packages
0
File Formats and Database Connections
